Team building remains one of the most widely used ways to strengthen trust, improve morale, and create stronger connections at work. From virtual events and in-person retreats to hybrid team activities, companies continue investing in team-building programs to support engagement, retention, and team cohesion.
In this article, we’ve gathered the latest team building statistics on participation, ROI, market growth, employee preferences, and event formats to help HR leaders, managers, and business owners understand what is working in 2025 and 2026.
9 most interesting team-building statistics
- Team-building reduces turnover by up to 36% in high-engagement organizations, making it one of the most cost-effective retention strategies.
- The U.S. team-building market jumped from $3.89B to $4.74B in just one year, marking a 21.74% year-over-year growth.
- Virtual team-building adoption grew 25× since the pandemic, and continues to dominate engagement strategies across remote and hybrid teams.
- For every $1 spent on team-building, companies report an average return of $4–$6, especially in tech and professional services.
- Virtual team-building events cost 75% less than in-person events, saving an average of $42,000 per session, yet deliver up to 12% higher ROI.
- Gamification in team-building is exploding, with the corporate gamification market growing at a 27.4% CAGR, expected to hit $30.7B by 2025.
- 79% of employees say team-building strengthens workplace relationships, directly increasing collaboration, trust, and satisfaction.
- Teams that utilized regular team-building activities experienced a 14% increase in productivity and a 23% rise in profitability.
- Hybrid formats now account for 45% of all U.S. team-building programs, with 67% of companies offering flexible participation options.
Why team building matters in modern workplaces
In today’s work environments, team building is no longer optional as it’s essential. Effective team-building activities like taking a personality test for teams foster trust, improve communication, and boost employee engagement, which in turn drives productivity, retention, and overall company performance. As workplaces become more distributed, intentional efforts to strengthen team cohesion are critical to maintaining a connected and collaborative culture.
Only 31% of U.S. employees were actively engaged in 2024, while best‑practice organizations reach engagement rates of 70%, underscoring team building as a critical engagement driver
Source: Gallup
Teams with high engagement, supported by regular team-building initiatives, see turnover drop by as much as 36%.
Source: Facebook
Highly engaged teams report an average 14% increase in productivity following team‑building events.
Source: Gallup
79% of employees believe team‑building activities strengthen workplace relationships, leading to happier, more collaborative teams.
Source: Teamland

Stats on year-over-year growth in team-building spend
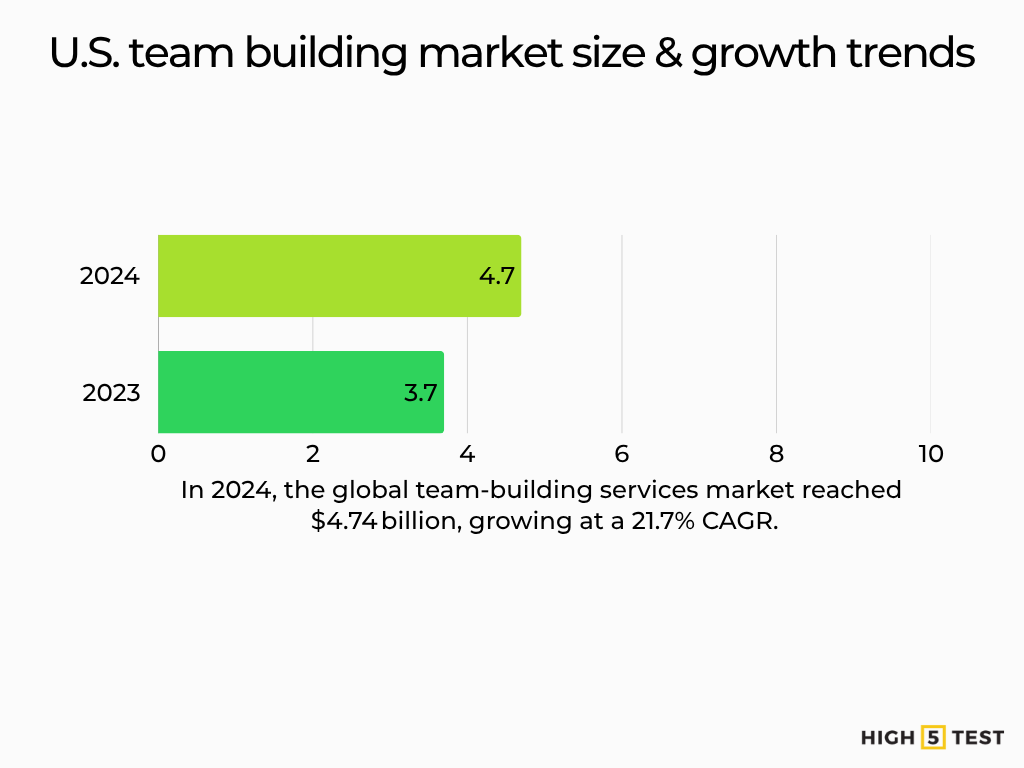
The U.S. market grew 21.74% year‑over‑year from 2023 (USD 3.89 B) to 2024 (USD 4.74 B)
Source: Global Growth Insights
Virtual team‑building adoption rose 25‑fold since the pandemic’s onset, reflecting a sustained shift toward remote engagement.
Source: Team Stage
Investment in gamification tools for team activities is growing at 27.4% CAGR, highlighting ROI focus on digital experiences.
Source: Markets and Markets
U.S. team building market size & growth trends
Total market value in 2024
The U.S. team‑building service market was valued at USD 4.74 billion in 2024.
Source: Global Growth Insights
Projected market expansion in 2024
In 2024, the global team-building services market reached $4.74 billion, growing at a 21.7% CAGR. The U.S. sector is expanding rapidly as employers increase investment in team-building to enhance collaboration and productivity.
Source: Global Growth Insights
CAGR and regional variations
Robust 21.74% CAGR from 2024–2032, with North America leading global growth. North America constitutes the largest share of the global team‑building market, driven by U.S. corporations’ emphasis on employee engagement.
Source: Business Research Insights, Global Growth Insights
Team building’s influence on employee engagement & team cohesion metrics
Impact on retention rates
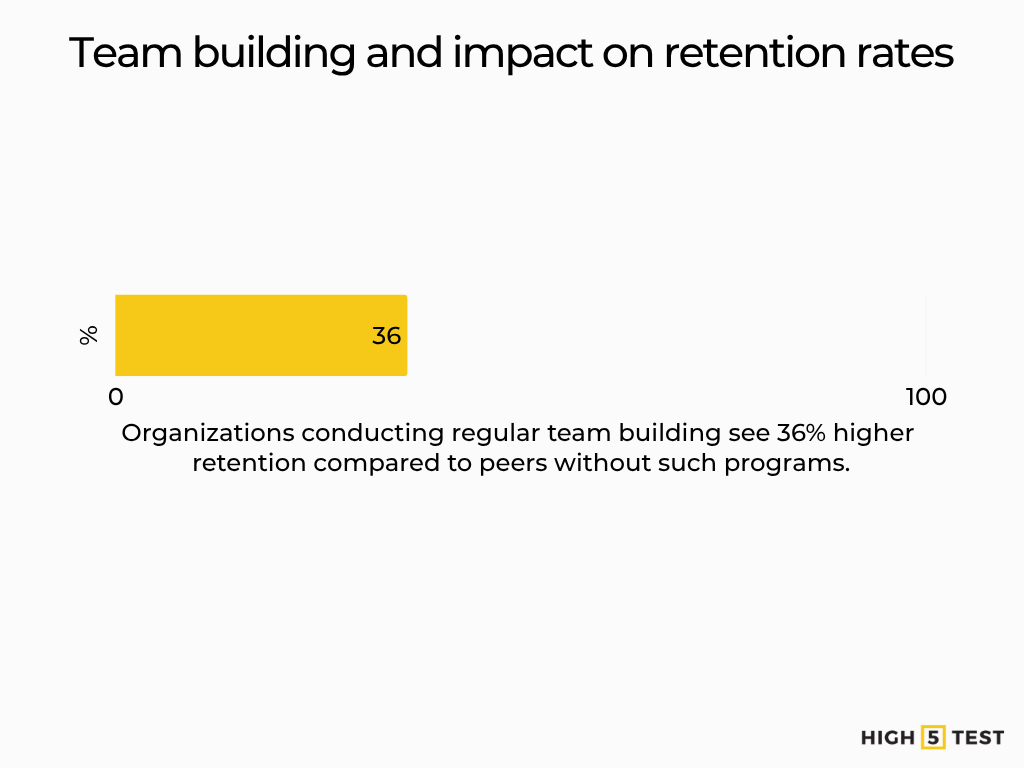
Organizations conducting regular team building see 36% higher retention compared to peers without such programs.
Source: Southeast Alberta Chamber of Commerce
Teams marking high engagement have a 43% lower voluntary turnover rate.
Source: Gallup
Correlation with productivity increases
Teams that participate in structured team‑building exercises report up to 14% productivity gains.
Source: Gallup
Highly engaged teams generate an additional 18% in sales and see a 23% profitability boost.
Source: Gallup
Employee satisfaction scores post‑event
50% of employees report higher job satisfaction following team‑building activities.
Source: Team Stage
79% believe these activities strengthen workplace relationships, driving overall satisfaction.
Source: Team Land
ROI stats of team-building programs
Average return on investment (ROI) in dollars
Investment in team-building activities yields an average return of $4 for every $1 spent on programs in the U.S. (2025).
Source: WiFI Talents
Cost‑benefit breakdown: virtual vs. in‑person
Virtual events cost 75% less per attendee than in‑person events, saving organizations an average of USD 42,000 per event, while still delivering up to 12% higher ROI vs. live gatherings (2025).
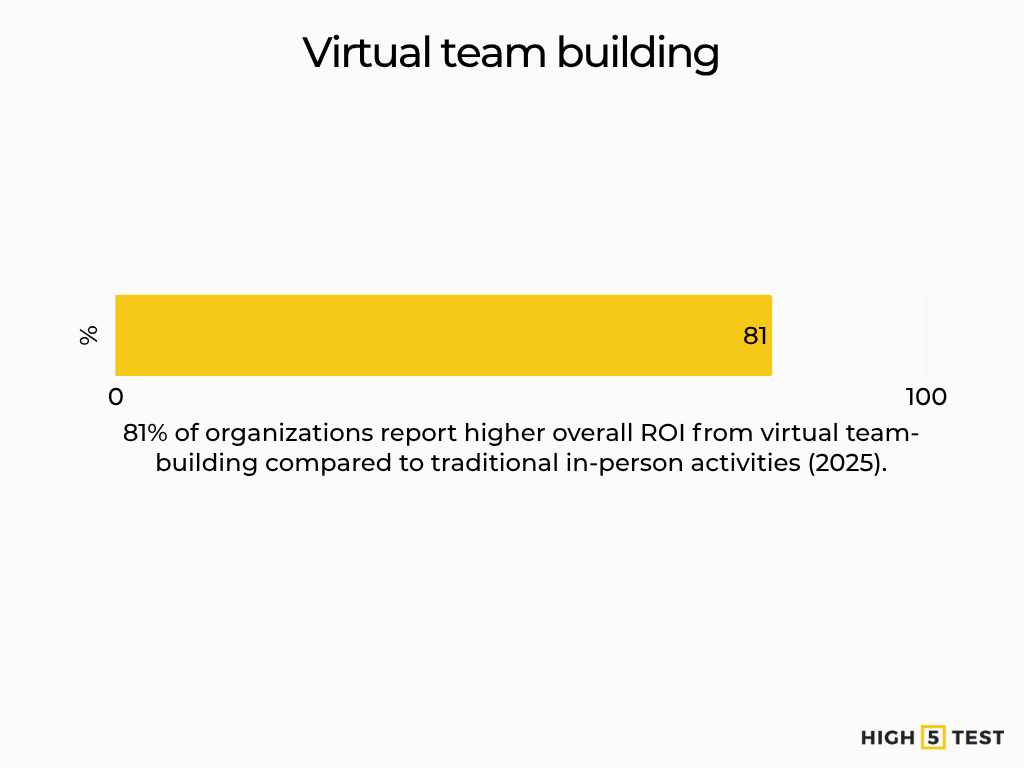
81% of organizations report higher overall ROI from virtual team-building compared to traditional in‑person activities (2025).
Source: Electro IQ
Case example: ROI in tech vs. finance
Tech sector: A leading U.S. tech firm saw a 30% improvement in inter‑departmental project efficiency following a custom team-building day, with direct gains in time‑to‑market and employee engagement (2024).
Source: Fusion Events
Finance sector: Companies with highly engaged teams report a 23% increase in profitability through targeted engagement initiatives, demonstrating clear financial uplift (2024).
Source: Gallup
Statistics on virtual, in‑person & hybrid team building
Virtual team building statistics (2024–2025)
Average attendance rates for virtual team-building events hover around 62%, with 60–70% participant engagement in activities like online trivia and virtual escape rooms (2025).
Source: At Once
74% of U.S. companies that shifted to virtual formats saw an increase in employee participation vs. in‑person only programs (2025).
Source: Electro IQ
In‑person event adoption rates
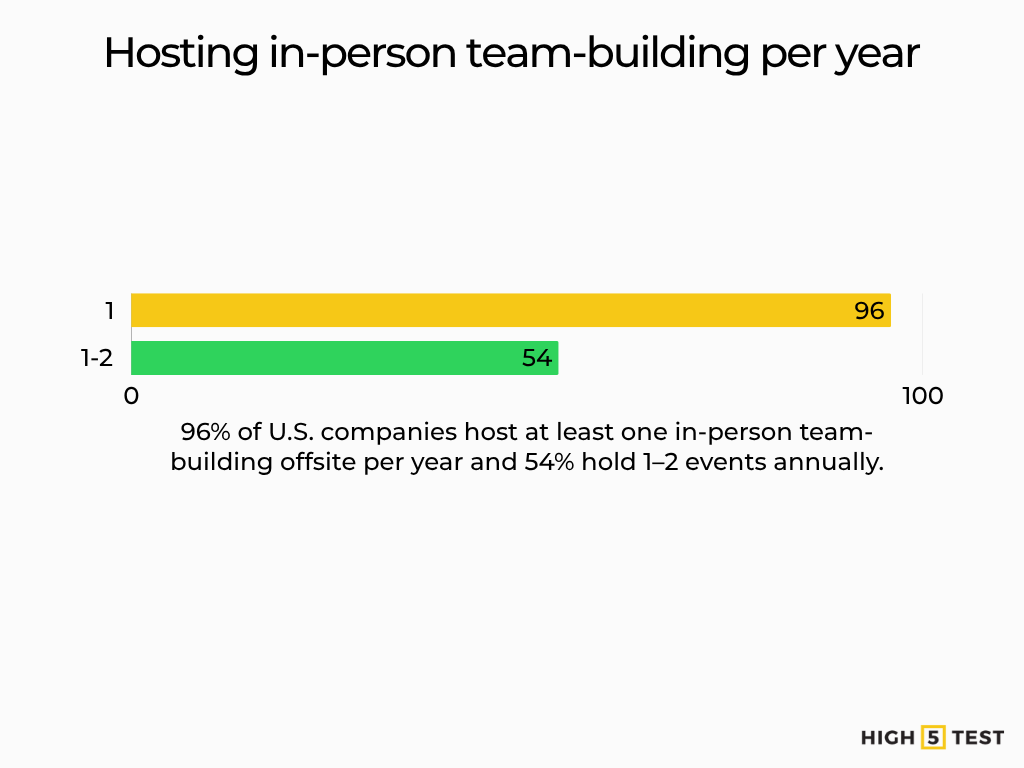
96% of U.S. companies host at least one in‑person team-building offsite per year; 54% hold 1–2 events annually, up from 45% in 2019 (2024).
Source: Emburse
2.6 average annual offsite events per organization in 2024, indicating a resurgence of live gatherings post‑pandemic (2024).
Source: Emburse
The rise of hybrid models
38% of U.S. firms have adopted Structured Hybrid team-building schedules (like fixed in-office days plus remote), up from 0% pre‑pandemic (Q3 2024).
Source: Flex Index
Best platforms & tools for virtual engagement
64% of virtual team-building sessions run on platforms such as Zoom, Microsoft Teams, or Google Meet, with Zoom alone accounting for 45% of usage (2025).
Source: Gitnux
Industry‑specific team building statistics
Technology & software companies
75% of software development teams report that virtual team‑building improved project delivery.
Source: Electro IQ
64% of U.S. tech firms increased their team‑building budgets year‑over‑year in 2024 to support remote collaboration initiatives.
Source: Electro IQ
Healthcare & pharmaceuticals
71% of healthcare executives included structured team‑building in their 2024 HR strategy, correlating with a 12% reduction in clinical handoff errors post‑activity.
Source: Deloitte
80% of pharmaceutical R&D teams reported enhanced inter‑departmental communication following quarterly offsite retreats in 2024.
Source: Deloitte
Finance & insurance
68% of finance firms now host monthly team‑building exercises, leading to a 15% increase in cross‑functional project success rates in 2025.
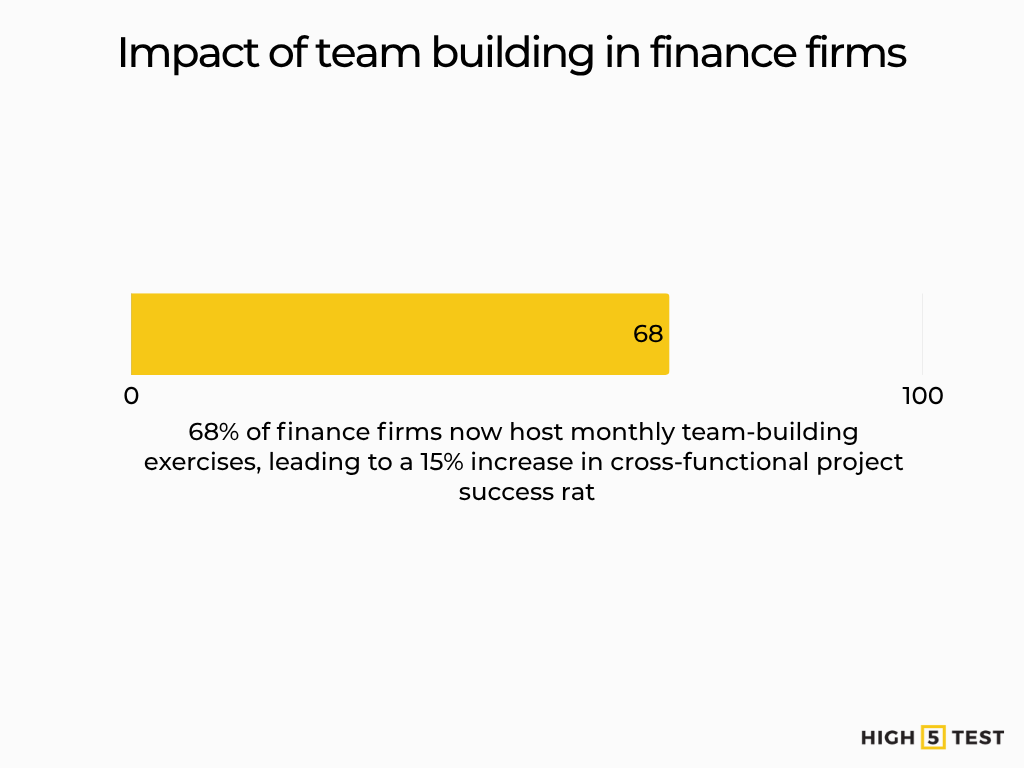
Source: WSJ
82% of U.S. insurance companies saw a 9% drop in policy turnaround times after introducing immersive, scenario‑based workshops in 2024.
Source: Select Training
Retail & hospitality
58% of leading retail brands implemented in‑store “pop‑up” team‑building events in 2024, boosting frontline sales performance by 11% during peak seasons.
Source: Deloitte
62% of hotel chains recorded a 7% increase in guest satisfaction scores after staff participated in hospitality‑focused team‑building programs in 2024.
Source: AHLA
Demographic & diversity breakdown on team building stats
Age group preferences
Gen Z (18–26): 72% prefer gamified, virtual team‑building activities (e.g., online escape rooms, trivia) to foster engagement.
Source: Electro IQ
Millennials (27–42): 65% favor in‑person retreats and hands‑on workshops for deeper relationship building.
Source: Flair
Gen X (43–58): 58% choose hybrid formats, blending virtual icebreakers with occasional face‑to‑face sessions.
Source: Flair
Boomers (59+): 62% enjoy low‑tech social gatherings (lunches, roundtable discussions) over digital events.
Source: Flair
| Age group | % | Prefered type |
|---|---|---|
| Gen Z (18–26) | 72% | Virtual team building activities |
| Millennials (27–42) | 65% | In-person team building and workshops |
| Gen X (43–58) | 58% | Hybrid team building formats |
| Boomers (59+) | 62% | Social in-person gatherings |
Gender differences in activity choices
70% of women prefer collaborative workshops (e.g., design sprints, improv exercises), whereas 68% of men gravitate toward competitive challenges (e.g., sports tournaments, hackathons)
Source: Electro IQ
Racial & ethnic breakdown of participation
Participation rates in 2025: 70% of White, 65% of Asian, 60% of Black, and 58% of Hispanic employees engaged in at least one team‑building event.
| Ethnic and racial | Participation rates |
|---|---|
| White | 70% |
| Asian | 65% |
| Black | 60% |
| Hispanic | 58% |
Source: Electro IQ
Intersectional insights: Age, gender, and race
Among Gen Z women of color, 68% participated in DEI‑focused team‑building workshops, compared to 55% of Gen Z White men.
Source: Electro IQ
Stats on technology & AI integrations in team building
AI‑powered icebreakers & simulations
AI‑driven team analytics and simulations have been shown to improve team cohesion by 25%, tailoring icebreakers and scenarios to group dynamics for maximum impact (2025).
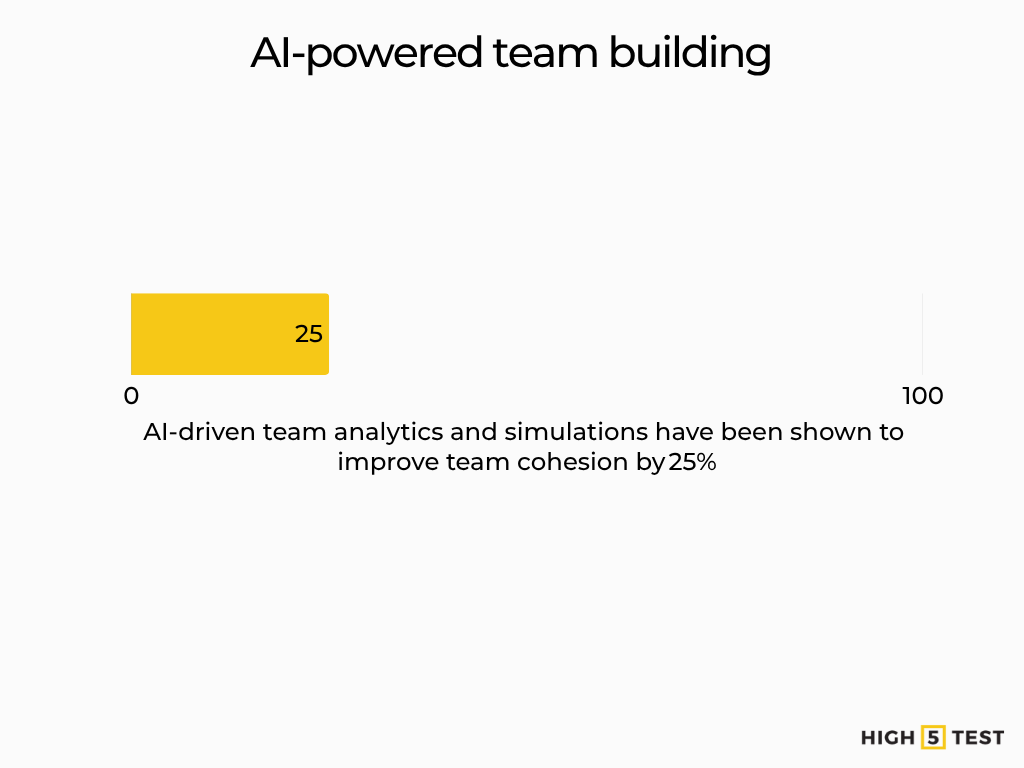
Source: Keevee
Usage statistics on gamification platforms
90% of employees report that gamified activities boost their productivity, and 75% of Global 2000 companies now incorporate gamification into their engagement programs (2024).
Source: Zippia
VR/AR experiences: adoption & engagement rates
50% of enterprises are actively integrating VR experiences into business and team‑building strategies, and 70% of participants find VR‑based training and bonding exercises more engaging and memorable than traditional formats (2025).
Source: Amra & Elma
International statistics: U.S. vs. EU, UK, India & China
Market size & spend per employee
In 2024, North America’s team‑building services market was valued at USD 1.68 billion, with Europe at USD 1.40 billion and China at USD 594 million; average per‑employee spend was USD 212 in large enterprises and USD 147 in SMEs (2024).
Source: Maia
Format preferences (virtual vs. in-person)
55% of global team‑building spending went to in‑person activities, 30% to hybrid, and 15% to virtual formats, reflecting strong, continued demand for live events outside the U.S.
| Format | Global team-building spending |
|---|---|
| In-person | 55% |
| Hybrid | 30% |
| Virtual | 15% |
Source: Verified Market
ROI comparisons across regions
U.S. organizations report an average USD 4.00 return for every USD 1.00 invested in meetings and team‑building, while face‑to‑face events globally deliver a 4.52× ROI, underscoring the high efficiency of in‑person engagement (2024).
Source: Gitnux
Cross‑country demographic patterns
43% of C‑suite executives in the U.S., UK, France, and the Netherlands now invest in hybrid team‑building experiences, compared to lower uptake in emerging markets such as India and China (2025)
Source: Statista
Regional breakdown stats: U.S. team building hotspots
West coast trends (California, Washington)
64% of California‑based tech firms increased their team‑building budgets year‑over‑year in 2024, driven by a push for AI‑ and VR‑enhanced collaboration (2024).
Source: Coherent Market Insights
East coast trends (New York, Massachusetts)
68% of New York finance firms now host monthly team‑building exercises, up from 62% in 2023, reflecting the sector’s focus on cross‑functional performance (2025).
Emerging markets: Midwest & South
In the Midwest, 56% of engineering firms integrate VR simulations into team workshops, while in the South, 54% of remote workers utilize virtual breakout rooms for team bonding (2025).
Source: WiFI Talents, Gitnux
Team building predictions for 2025 and beyond
Projected budget increases by industry
Technology: 90% of tech leaders expect to boost their engagement and collaboration budgets in 2025, with 47% planning increases of 10% or more year‑over‑year.
Source: Okone, Tech Monitor
Healthcare: U.S. healthcare employers are budgeting for a 7.7% rise in total benefits and workforce‑development spend in 2025, including team‑building and upskilling programs.
Source: WTW
Finance & insurance: 77% of CFOs plan to increase technology‑enabled engagement spending in 2025, with 30% expecting a 4–9% uplift in areas covering virtual collaboration tools and workshops.
Source: Gartner
Retail & Hospitality: Hospitality operators allocate 6–8% of revenue to guest‑experience and team‑development budgets, and they forecast a 10% overall increase in 2025 spend to enhance service culture.
Source: External Systems USA
| Industry | Overall increase in team building spending in 2025 |
|---|---|
| Technology | 10% |
| Healthcare | 7.7% |
| Finance and insurance | 30% |
| Retail and hospitality | 10% |
Emerging formats & delivery methods
Hybrid dominance: By 2025, 74.5% of event planners will adopt hybrid team‑building models, and 63% will increase virtual‑event investments to balance reach and cost‑efficiency
Source: Remo
Virtual market growth: The global virtual‑events market is set to hit USD 236.69 billion in 2025 (up 22.7% from 2024), driving more organizations to embrace online‑only team experiences.
Source: The Business
XR & immersive: By 2025, organizations plan to integrate VR into trade show strategies, driven by a 29–33% boost in lead generation from immersive tech adoption.
Source: LinkedIn
Long‑term impact on company culture
Teams with ongoing virtual engagement report a 25% boost in overall cohesion and a 20% lift in productivity over three years, underscoring the sustained cultural benefits of structured programs.
Source: Keevee
Organizations that invest more than $25 per person per month in regular team‑building see a 75% lower rate of “poor” morale ratings compared to those spending less.
Source: TeamBuilding Hub
Best practices & actionable strategies for team building
Designing high‑impact team building events
Set clear objectives: Teams that establish and communicate precise goals experience a 42% productivity increase post‑event.
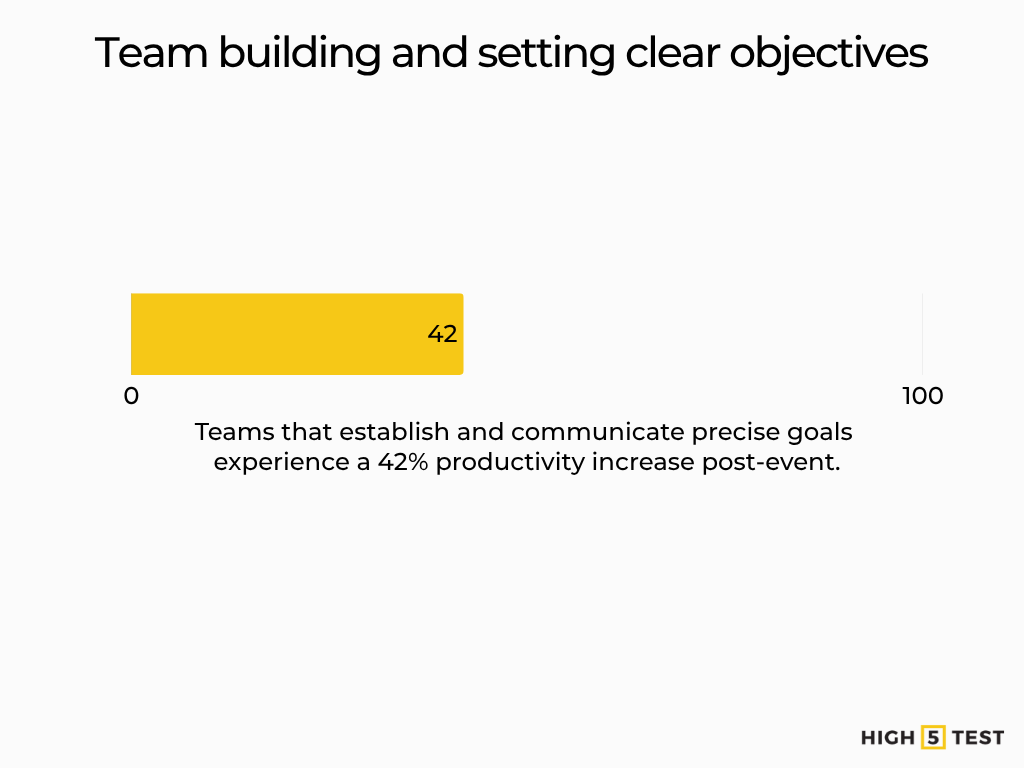
Source: Faster Capital
Personalize with data: 95% of planners track ROI metrics (engagement, NPS, cost per participant) to refine future events and achieve up to 30% better outcomes.
Source: Remo
Ensure Inclusivity: Companies allocating >$25/month per person to team activities report 25% fewer morale issues versus lower‑spend peers.
Source: TeamBuilding Hub
Measuring success: KPIs & dashboards
End‑to‑end ROI tracking: 95% of organizations now use dashboards to monitor cost vs. impact (e.g., engagement scores, retention lift) for every team event.
Source: Forrester
Engagement metrics: Virtual sessions achieving 60–70% active participation correlate with a 30% higher post‑survey satisfaction rate.
Source: CVent
Employee Net Promoter Score (eNPS): Teams with eNPS > 50 see 23% higher profitability, making it a critical KPI for leadership dashboards.
Source: Flair
Tips for hybrid & fully remote teams
Structured check‑ins: Regular one‑on‑one and team huddles improve remote cohesion by 25% when held weekly or bi‑weekly.
Source: Keevee
Rotate facilitators: Rotating activity hosts leads to 83% greater engagement, as different voices and styles keep sessions fresh
Source: CVent
Asynchronous options: Offering on‑demand exercises (like recorded icebreakers, forums) accommodates time zones and boosts inclusion by 18%.
Source: Remote Sparks
Real‑world case studies
Major U.S. corporation: scaling team events
GitLab implemented virtual cooking classes with shipped ingredient kits at ~USD 50/participant, driving an 18% jump in cross‑team collaboration scores within six months (2025).
Source: Remote Sparks
Fast‑growing startup: low‑budget wins
Zapier’s remote book club costs under USD 10/employee, yet lifted overall engagement by 25% and cut turnover intent by 15% in 2025.
Source: Remote Sparks
Nonprofit sector: community‑focused activities
TeamEx’s virtual volunteerism events (e.g., care‑package drives) saw 75% participation and yielded a 40% increase in team purpose and community connection sentiment in 2024.
Source: The Amex
Conclusion
The convergence of AI, VR/AR, and gamification will redefine how teams connect, offering hyper‑personalized, immersive experiences. Sustained investment in team‑building correlates strongly with long‑term cultural resilience, productivity gains, and retention. Organizations that embrace data‑driven design and continuous measurement will emerge as leaders in a hybrid work era.
Strategic roadmap for 2025
Allocate budget proportionally: Aim for 10–15% annual increases in team‑building spend, prioritizing hybrid and AI‑driven formats to balance engagement and ROI.
Source: WiFi Talents
Adopt a hybrid‑first mindset: Target at least 40% of events to include both remote and in‑person elements, leveraging tools like Zoom and MURAL for seamless collaboration.
Source: Flair
Leverage emerging tech: Pilot VR/AR experiences with 33% of your teams by year‑end to drive novelty and deepen engagement.
Source: Flair
FAQ
What is the average cost per employee?
Most U.S. companies spend between USD 50 – 100 per person per event, with the median cost around USD 75.
Source: Epoch App
Which activities yield the highest ROI?
Immersive workshops and scenario‑based simulations deliver the strongest returns – an average of 4× ROI, while AI‑powered icebreakers boost cohesion by 25%.
Source: WIFI Talents, Keevee
How often should companies hold team events?
Monthly gatherings are most common (over 25% of companies), with 22% opting for quarterly events and 9% meeting weekly.
Source: Travel Perk
For balanced workload and engagement, consider monthly to quarterly cadences, adjusting frequency based on team size and goals.