Employee retention statistics show how effectively organizations are keeping their talent and where potential risks exist. As the labor market continues to shift due to changing expectations around remote and hybrid work, inflation, and AI-driven disruption, maintaining workforce stability has become a strategic priority.
This article covers:
- Overall retention and turnover rates
- Voluntary vs involuntary split
- Differences by industry, tenure, and role
- Top reasons employees quit
- Trends and forecasts for 2025
- Retention benchmarks and key metrics
- Actionable levers companies can use
- Data methodology and caveats
By the end, you’ll have a clear, data-driven view of retention in 2024–2025 and a playbook for improvement.
10 most interesting employee retention statistics
- Voluntary turnover rate in the U.S. (2024–2025): 13.0%
- Quits account for 3.2 million of 5.3 million separations (July 2025)
- 42% of voluntary turnover is preventable
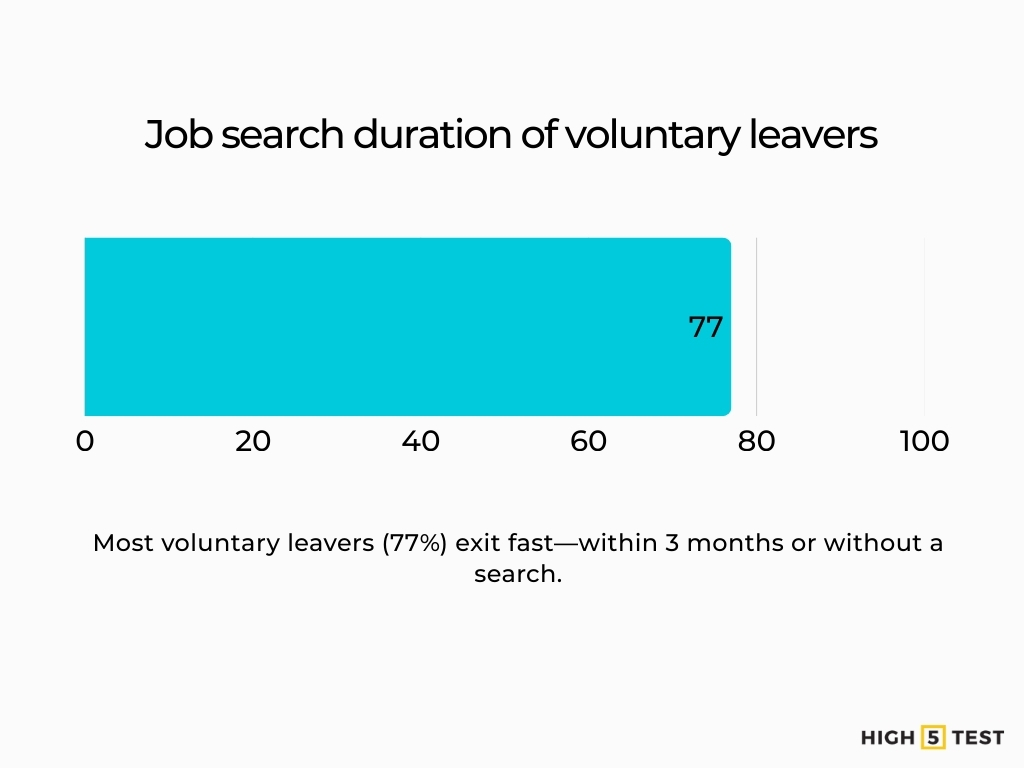
- 77% of voluntary leavers leave within 3 months of starting a job search or leave without actively searching
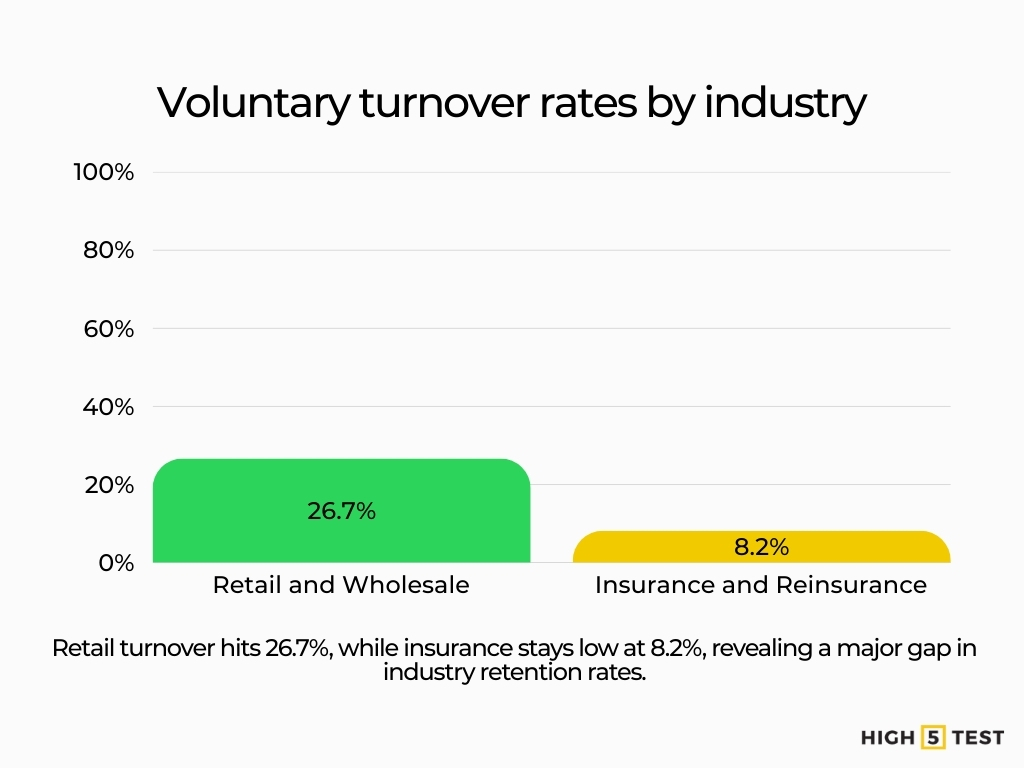
- Retail & Wholesale voluntary turnover rate: ~26.7%
- Lowest industry turnover (Insurance/Reinsurance): ~8.2%
- Turnover by role (e.g. non-sales professionals ~9.1%; para-professional blue collar ~12.5%)
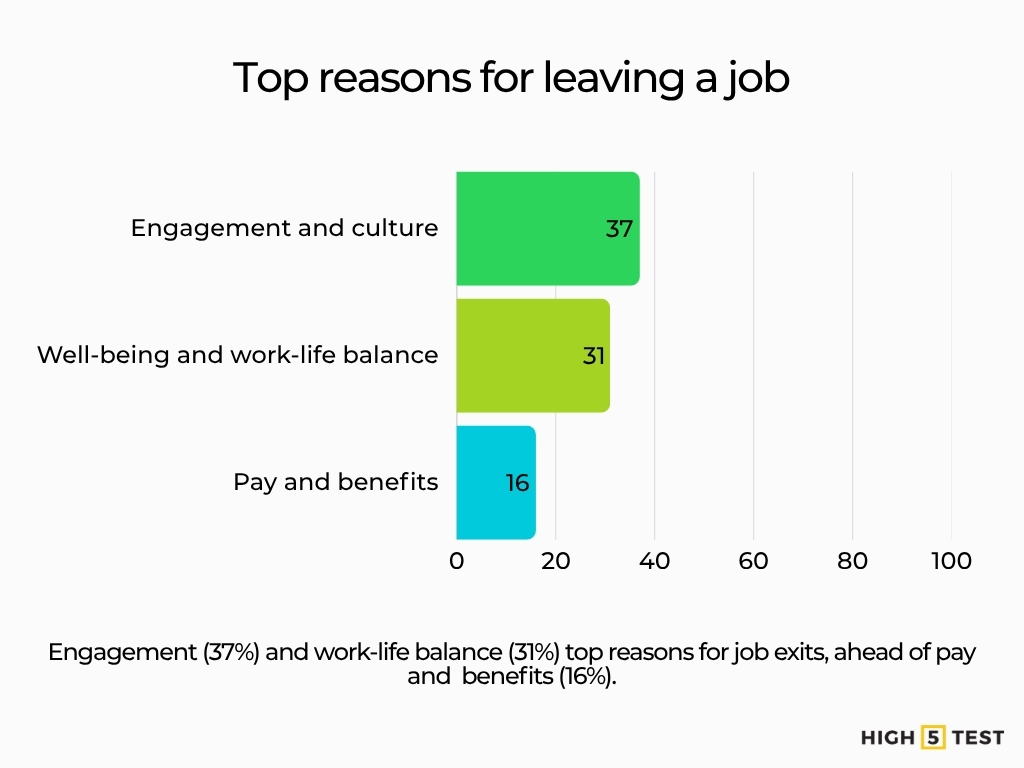
- Top reasons for quitting: 37% culture/engagement, 31% well-being/work-life balance, 16% pay/benefits
- 51% of U.S. employees in 2024 say they are “watching or actively seeking” another job
- Replacing a leader can cost up to 200% of the leader’s salary (80% for technical roles, 40% for frontline roles)
Employee retention and turnover rates
Overall voluntary turnover/retention rate
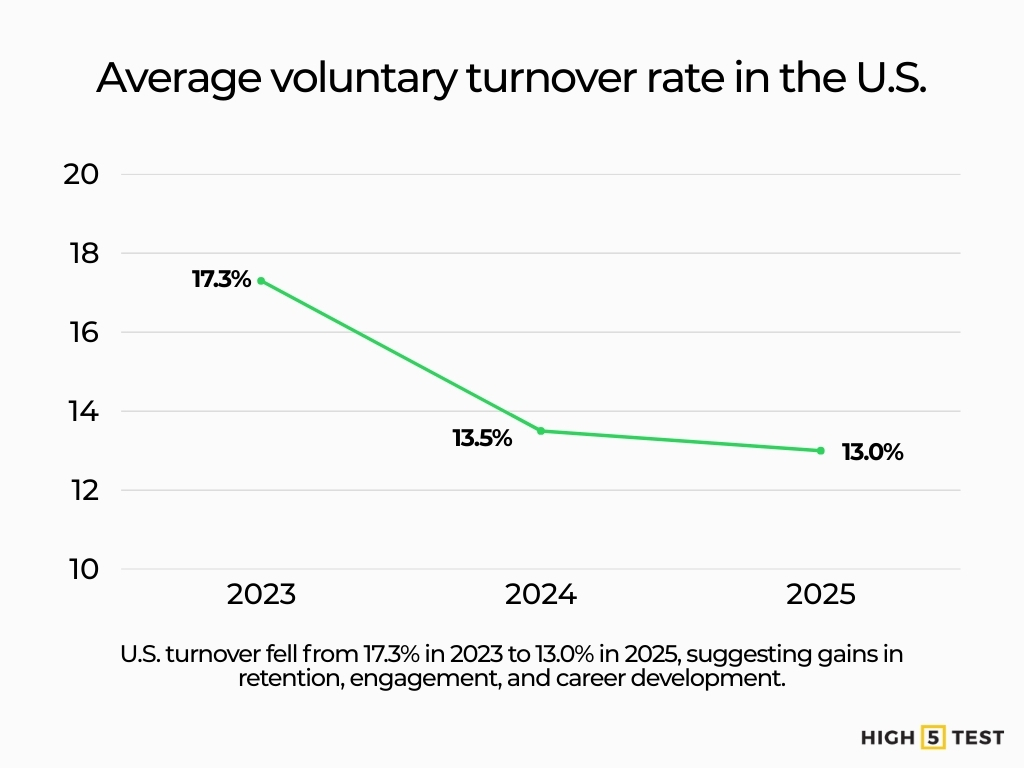
The average voluntary turnover rate in the U.S. for 2024–2025 (excluding retirees, contractors, volunteers) is 13.0%.
This is a decline from prior years: the 2023 average was ~17.3%, and 2024’s was ~13.5%. This suggests a cooling of turnover pressures from the peak years of the Great Resignation.
Source: Imercer
Voluntary vs. involuntary separation
In July 2025, quits accounted for 3.2 million of the total 5.3 million separations. That implies that quits (voluntary separations) remain a major component of turnover.
Source: Bureau of Labor Statistics
It is estimated that 42% of voluntary turnover is preventable, meaning that nearly half of the people who leave could have been retained with better management, engagement, or organizational responsiveness.
Source: Gallup
Retention/stay rates
Many employees leave within short time spans after considering new opportunities. 77% of voluntary leavers either left within three months of starting their job search or left without actively searching.
Source: Gallup
In exit-interview aggregate data, the concept of “retention truth” is emphasized: retention is not accidental but the result of deliberate actions.
Source: Work Institute
It’s harder to find a uniform “5-year stay rate” number in recent public data, because many reports focus on annual churn.
Retention by industry and segment
Industry-level comparison
Retail and Wholesale reports the highest turnover rate (~26.7%), while Insurance/Reinsurance has one of the lowest (~8.2%).
Source: Imercer
Some verticals like healthcare and nursing are particularly challenged: in 2025, U.S. hospitals aim to reduce RN turnover, with baseline turnover in some regions as high as ~18.3%.
Source: NSI Nursing Solutions, Inc
Organizational size, region, geography
Data is scarcer at state or regional granularity in recent reports, but full-time voluntary turnover in higher education in 2024 remained above pre-pandemic levels at 10.7%, though slightly down from 11.4% in 2023.
Source: CUPA-HR
Smaller firms often have fewer buffers or resources for retention programs, though large firms may also struggle with scale, bureaucracy, or distance from employees.
Employee segment comparisons (role, tenure)
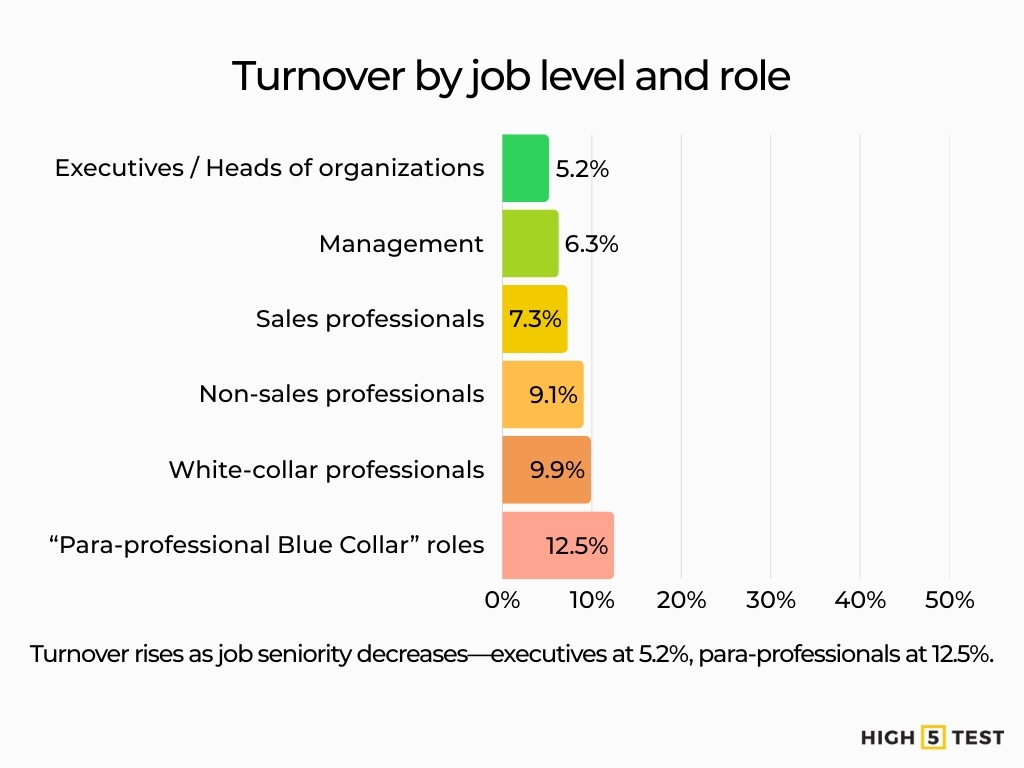
The following data shows turnover by role:
• Executives/heads: ~5.2%
• Management: ~6.3%
• Sales professionals: ~7.3%
• Non-sales professionals: ~9.1%
• White collar: ~9.9%
• Para-professional blue collar: ~12.5%
In fast-turnover segments (hourly, frontline, retail), turnover tends to be significantly higher in early tenure (0–1 years).
Source: Imercer
Academic research suggests that return-to-office mandates can disproportionately reduce tenure for more senior workers, thereby accelerating attrition in that cohort.
Source: arXiv
Key drivers and reasons for leaving
Top reasons employees quit
U.S. employees identified their primary reason for leaving their previous job:
• Pay/Benefits was cited as the primary reason in 16% of cases.
• Engagement and Culture accounted for 37% of the reasons.
• Well-being/Work-Life Balance accounted for 31%.
Retention isn’t just about salaries. To reduce turnover, organizations must invest in a healthy workplace culture and support systems that promote employee engagement and work-life balance.
Source: Gallup
51% of U.S. employees in 2024 say they are “watching or actively seeking” another job. This suggests a highly fluid labor market, with over half the workforce open to change, posing a significant retention challenge for employers.
Source: Gallup
Replacing a leader can cost up to 200% of the leader’s salary; for technical roles, 80%; for frontline roles, 40%. Turnover is not only disruptive, it’s also expensive. The higher the role, the steeper the cost in recruitment, training, and lost productivity.
Source: Paycor
Preventable vs. less preventable causes
The 42% preventable turnover estimate suggests that many leavers are responding to issues that businesses could proactively manage (e.g., poor relationships with managers, unmet development expectations, lack of recognition).
Source: Gallup
Another data shows that themes such as career stagnation, poor management, and a lack of work-life balance accounted for 63% of all exits in 2024 and are flagged as systemic retention gaps.
Source: Work Institute
Emerging/contextual factors
Remote/hybrid work flexibility has become a key retention lever; removing it or pushing strict return policies can trigger departures.
Employee perceptions of job security in uncertain times (economic slowdown, AI disruption) influence decisions.
In academic research, AI adoption and changes in performance evaluations may affect employee trust, fairness perceptions, and retention.
Source: arXiv
Shared negative shocks (reorganizations, crises) can paradoxically strengthen commitment when employees perceive aligned incentives and transparent leadership.
Source: arXiv
Employee retention trends and forecasts
Year-on-year trends
During the Great Resignation period (2021-2022), the U.S. labor market experienced an unprecedented surge in quit rates and voluntary turnover. By 2023, reports estimated that around 45 million Americans, approximately 27% of the workforce, had voluntarily left their jobs.
Source: IESE, Work Institute
While these figures reflected a historic wave of exits, recent data suggests the trend is moderating. For instance, turnover dropped from about 17.3% in 2023 to 13.0% in 2024–2025, and another data shows that quits and separations have begun to stabilize. Organizations must not mistake stabilization for resolution; a proactive retention strategy is still critical.
Source: Imercer, Bureau of Labor Statistics
Projections for 2025 and beyond
Some analysts warn that retention may worsen in mid-2025, as the index fell 6.2 points in January 2025 from the previous quarter to 98.5, citing downward trends in retention indices.
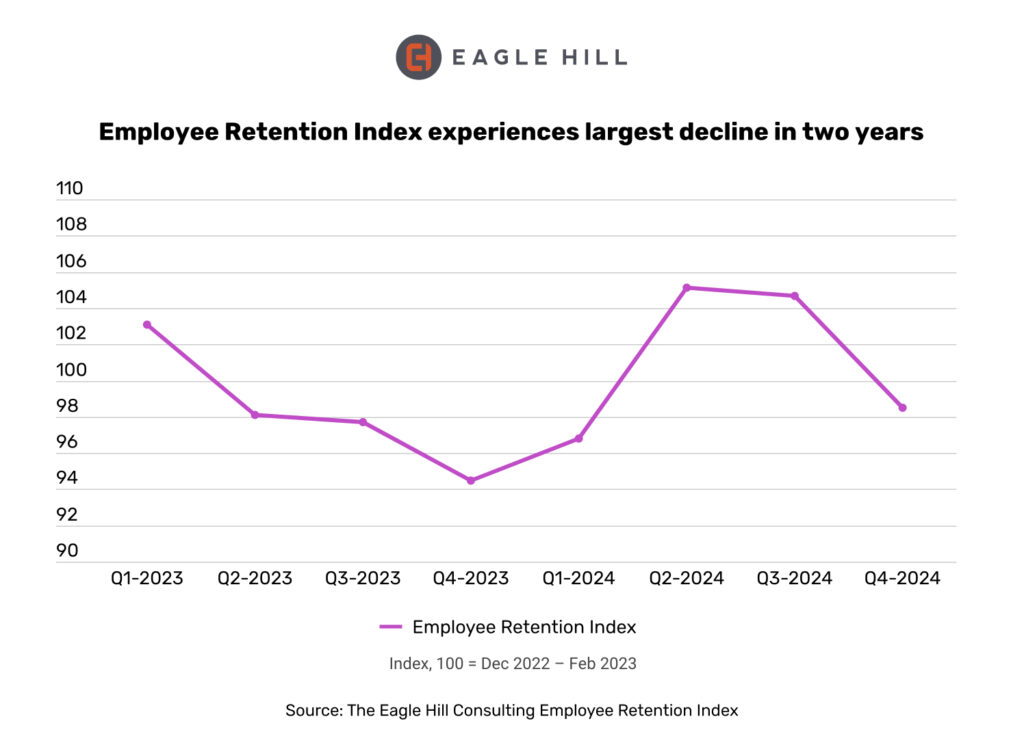
Source: Eagle Hill Consulting
HR executives still rank retention as their number one concern in 2025: 66% say so.
Source: Gallagher
If voluntary turnover holds near 13%, the volume of leavers remains high in absolute terms across a large workforce. Shifting workforce expectations (e.g., from younger generations) may pressure retention unless organizations evolve rapidly.
What’s changing in employee expectations
Employees increasingly expect meaningful growth, flexibility, and employer responsiveness. The “talent hold” hypothesis suggests organizations with strong cultures and purpose can shift from reactive retention to proactive loyalty. AI, automation, and reskilling pressures mean employees will assess not just current satisfaction but the future viability of roles.
Benchmarks and best-in-class metrics
Retention-related KPIs to track
- Onboarding attrition (number or % leaving within first 3–6 months)
- One-year retention rate (how many employees stay past 12 months)
- Internal mobility/promotion rate (movement within org)
- Exit reason distribution (via exit surveys)
- Stay interviews/intent-to-stay metrics (regular pulse checks)
- Attrition risk scores (via analytics / predictive modeling)
Advanced measurement/predictive models
Organizations increasingly use data science, ML, or even LLM-based models to predict attrition risk. For example, GPT-3.5 fine-tuned models have been shown to outperform traditional classifiers on HR attrition datasets.
Source: arXiv
Use hazard/survival analysis (from biostatistics) to estimate “churn curves” by tenure. Combine quantitative metrics with qualitative feedback (open responses, sentiment analysis) for richer insight.
Final thoughts
Voluntary turnover in the U.S. is showing signs of stabilizing in 2024–2025, following the sharp fluctuations during the Great Resignation. Yet, at ~13 % voluntary turnover, the rate remains a significant concern for HR leaders. Addressing this requires more than reactive measures. Retention must be treated as a strategic priority. That includes applying people analytics, strengthening culture, supporting flexible work, and ensuring strong leadership at every level.
Looking ahead to 2026, pay attention to generational shifts, the influence of AI, economic trends, and changes in job design. Organizations that succeed will be those that build loyalty, encourage purpose, and stay adaptable.