Recruiting in 2025 looks different, but it’s just as competitive. Labor shortages, AI-driven workflows, and shifting candidate expectations are reshaping how U.S. companies attract and retain talent.
Below is a comprehensive list of the latest, authoritative recruitment statistics you need to benchmark your strategy, covering everything from hiring trends and time-to-fill metrics to AI adoption, DEI, and early-career pipelines.
10 most interesting recruitment statistics
- Nearly every “employable” person is already employed (83.7% prime-age participation).
- There are 7.2M openings but only 5.1M hires — a structural hiring gap.
- AI isn’t optional anymore: 92% of leaders plan to increase AI investments.
- Skills-based hiring can expand candidate pools by 6.1x.
- 42% of candidates decline offers due to a bad interview experience.
- Replacing a single employee costs 50–200% of their salary.
- Time-to-fill for senior/technical roles now exceeds 90 days.
- Only 12% of full-time roles are fully remote, but 87% of job seekers want remote options.
- Diversity delivers a 39% performance advantage for top-quartile companies.
- HR analytics can increase productivity by 25% and hiring efficiency by 80%.
40+ recruitment statistics in the U.S. (2024-2025)
The U.S. reported 7.2 million job openings in August 2025, a 4.3% job openings rate, indicating that hiring demand remains historically high despite a slight cooldown.
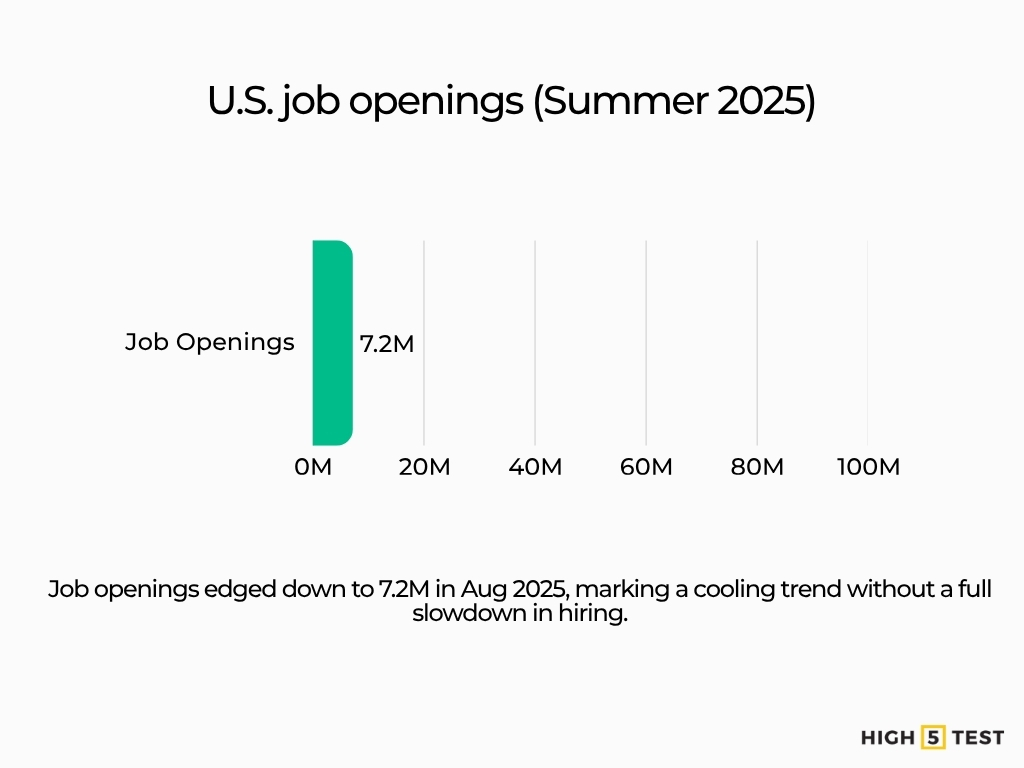
Source: Bureau of Labor Statistics (JOLTS)
Employers made 5.1 million hires that same month, reflecting a 3.2% hiring rate and an ongoing struggle to close the gap between openings and placements.
Source: Bureau of Labor Statistics (JOLTS)
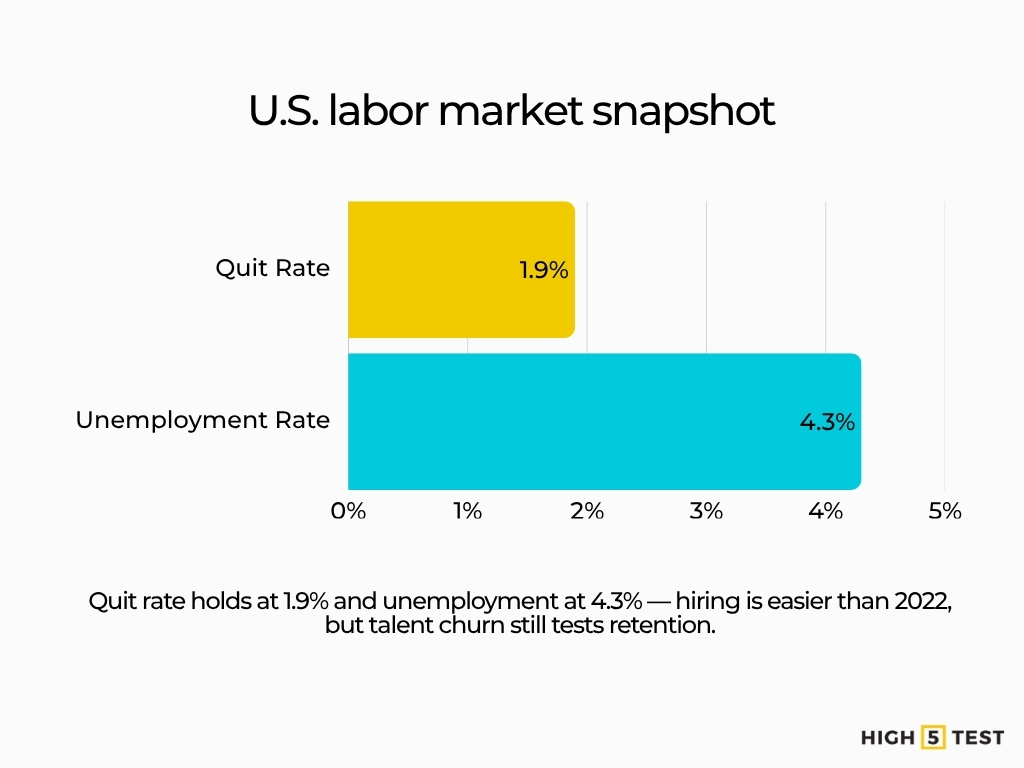
The quit rate held steady at 1.9%, signaling that while the “Great Resignation” has faded, voluntary turnover still pressures retention.
Source: Bureau of Labor Statistics (JOLTS)
Unemployment averaged 4.3% in August 2025, giving recruiters a slightly larger but still competitive talent pool.
Source: Bureau of Labor Statistics
With prime-age labor-force participation at 83.7%, its highest since 2002, nearly everyone employable is already employed, making proactive sourcing essential.
Source: Bureau of Labor Statistics
Statistics on recruitment costs and time spent
The median U.S. time-to-fill reached 45–50 days in 2025, showing hiring cycles are lengthening as employers add more screening steps.
Source: SHRM Recruiting Benchmark 2025
Technical and senior roles need more than 90 days to fill, reflecting ongoing shortages in specialized skills.
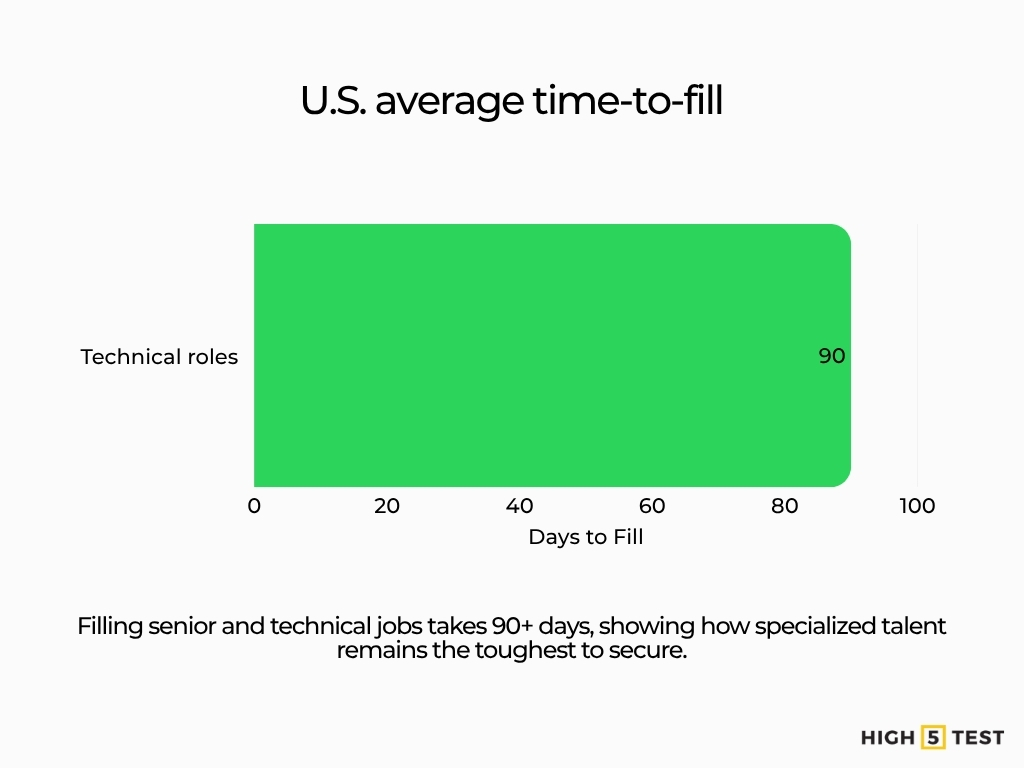
Source: HR Research Institute
The cost-per-hire for executive roles reached $10,625 and $1,200 for non-executive roles, underscoring how every extra week of vacancy inflates both expense and lost productivity.
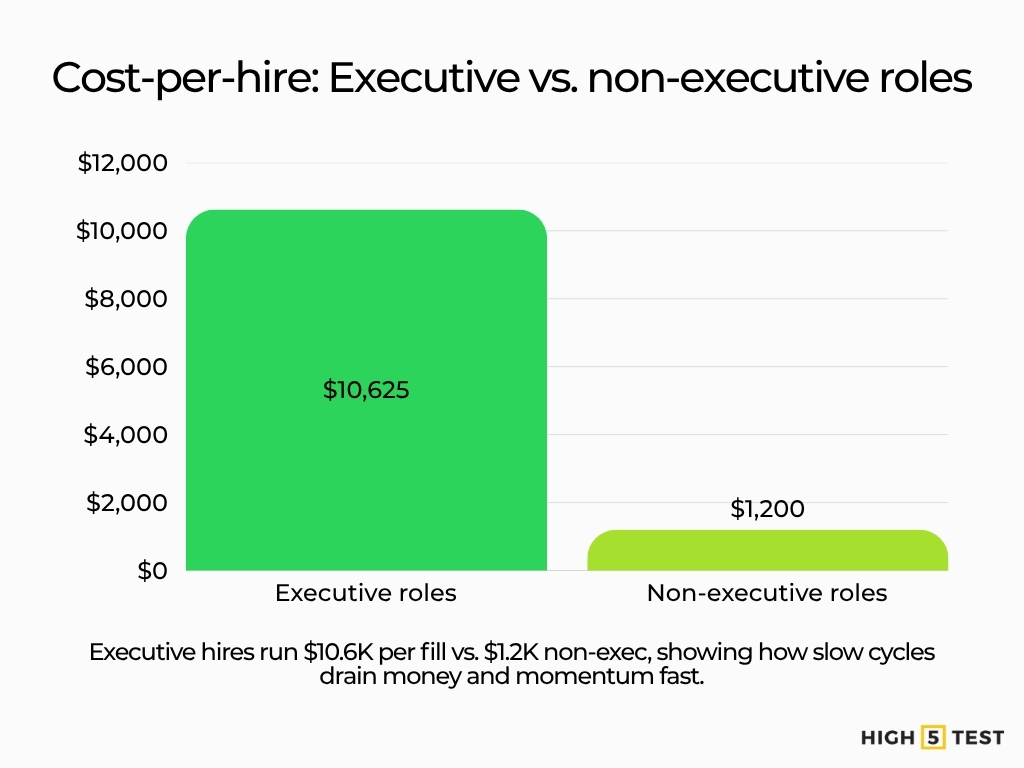
Source: SHRM Recruiting Benchmark 2025
Companies with standardized recruiting processes and that maximize their internal talent fill their open executive job positions internally 50% of the time, proving that efficiency, not budget, drives success.
Source: SHRM Recruiting Benchmark 2025
Statistics on AI and automation implementation in recruitment
Nearly 8 in 10 (78%) now use an ATS, confirming that technology has become the backbone of U.S. recruiting.
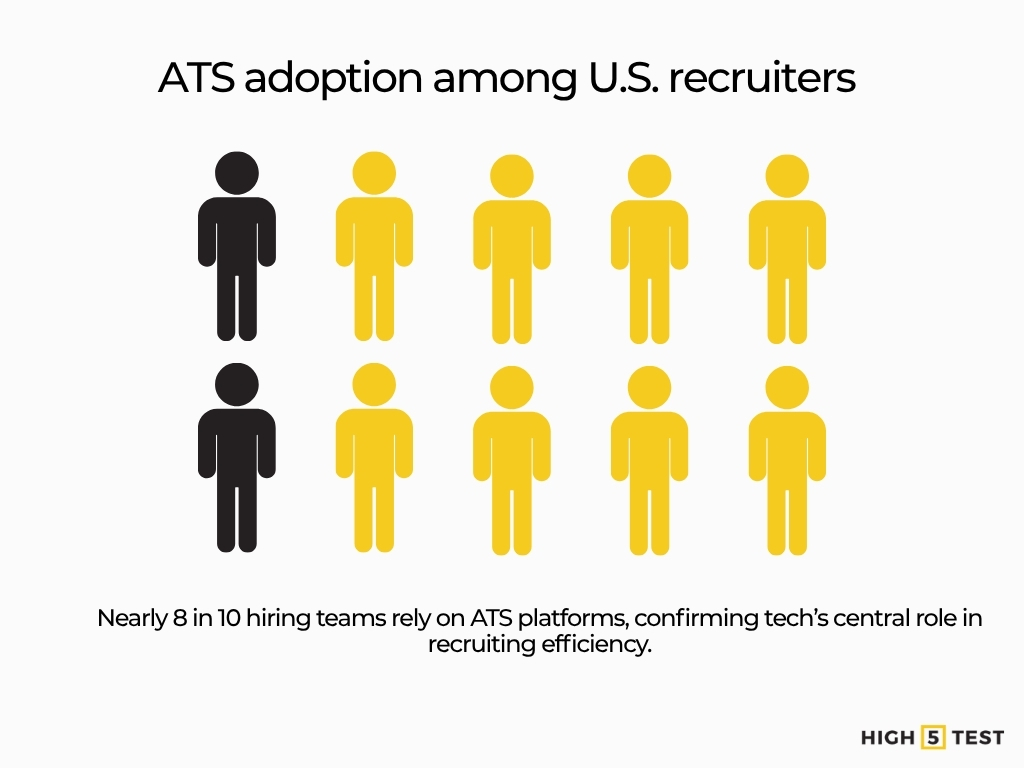
Source: HR Research Institute
72% of HR leaders use AI tools for sourcing or screening, marking a permanent shift from manual workflows to data-driven hiring.
Source: HireVue
Recruiters using AI report cost-per-hire reductions of up to 30%, helping them save time and increase their efficiency.
Source: SHRM
92% of leaders plan to increase their AI investments, fueling an industry-wide race toward smarter analytics.
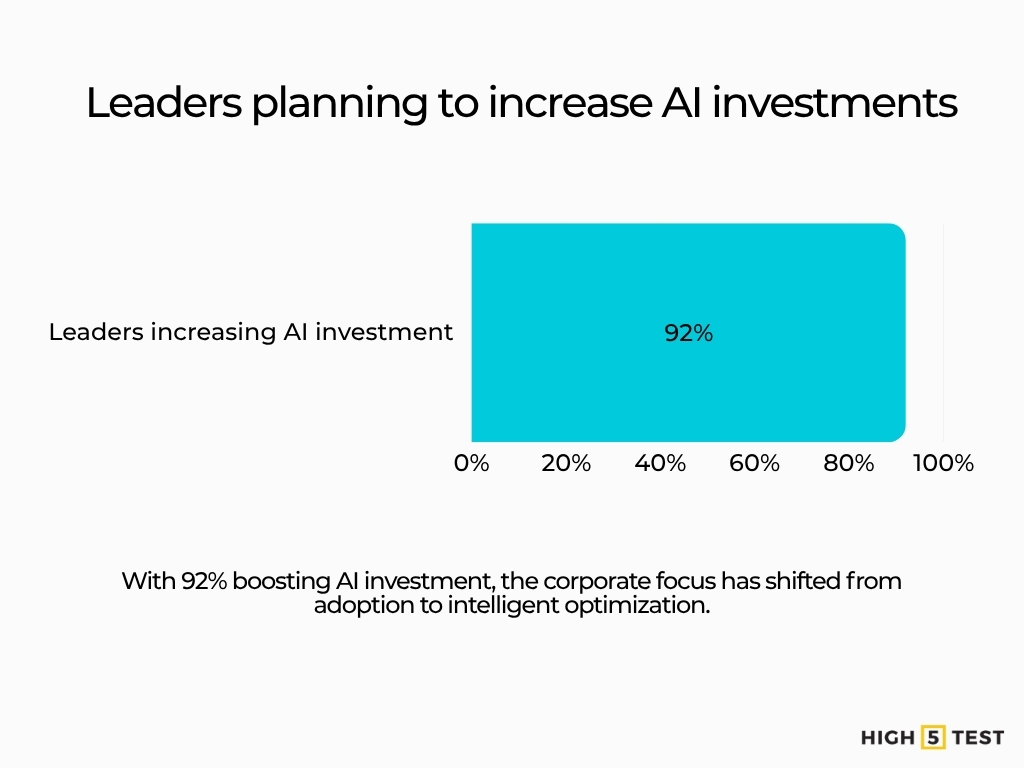
Source: McKinsey
Statistics on candidate experience during recruitment
The average U.S. interview process is 24.2 days, and drawn-out cycles risk losing top candidates to faster competitors.
Source: The Interview Guys
65% of candidates don’t receive consistent communication, making recruiter responsiveness a key differentiator.
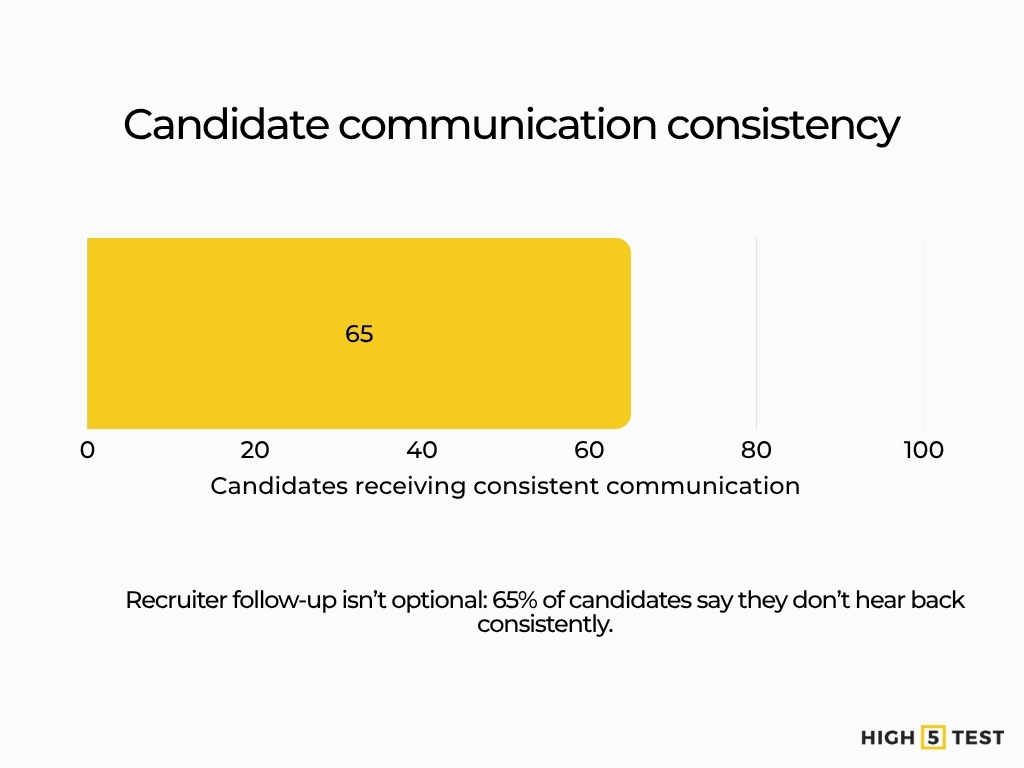
Source: Aptitude Research
42% of candidates decline offers due to bad interview experience, mostly due to a recruiter being dismissive, condescending, or hostile.
Source: SHL
Statistics on DEI in recruitment
56% of job seekers value workplace diversity, turning DEI from a moral issue into a brand expectation.
Source: Pew Research Center
53% of S&P 100 companies are adjusting their DEI messaging, structure, or terminology, signaling evolution over exit.
Source: The Conference Board
Organizations in the top diversity quartile outperform peers by 39%, proving inclusion directly impacts profitability.
Source: McKinsey
Stats on how remote and hybrid work redefine recruiting
- 27.9% of U.S. employees worked remotely part-time in 2024, cementing hybrid work as the new normal.
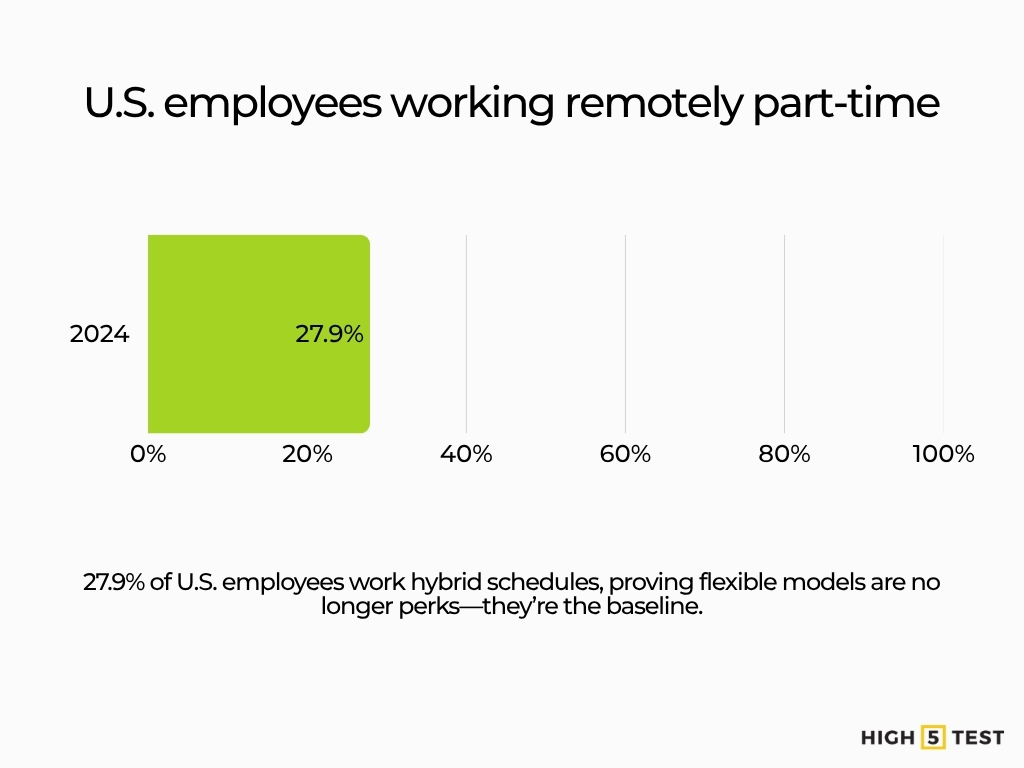
Source: Bureau of Labor Statistics
Only 12% of full-time roles are fully remote, making flexibility a competitive hiring edge.
Source: Robert Half
Most job seekers (87%) are prioritizing remote work in their search, underscoring flexibility’s magnetic pull.
Source: Cultivated Culture
84% of leaders backing flexible models cite higher productivity, and 62% aim to boost talent recruitment, a signal that flexibility is now a growth lever.
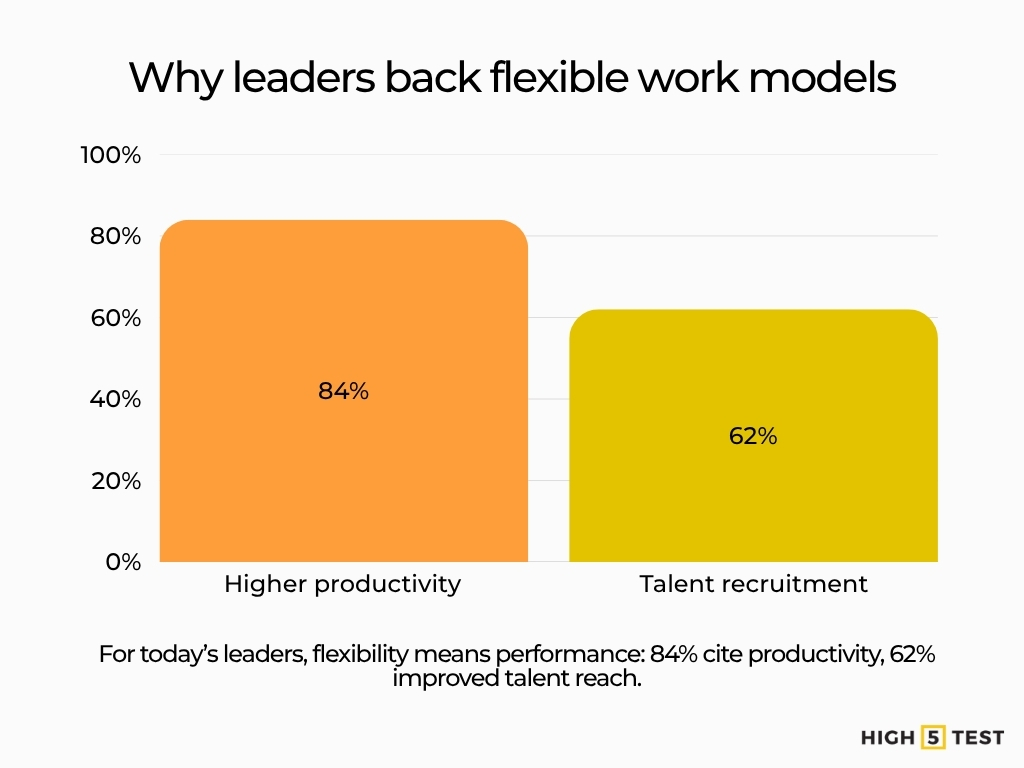
Source: Zoom
Statistics on recruitment channels and funnels
91 percent of recruiters use social media to source candidates, confirming digital visibility as table stakes.
Source: StandOut CV
Over 9,000 people apply for jobs on LinkedIn every minute, or about 90 million weekly job searches, solidifying its role as recruiting’s primary marketplace.
Source: LinkedIn
83% of applicants read company reviews before applying, turning reputation into an acquisition metric.
Source: Glassdoor Research
Insights and data on salary information in job posts
Pay-raise budgets will average 3.9% in 2025, down from 4.3% in 2024, as wage growth steadies alongside inflation.
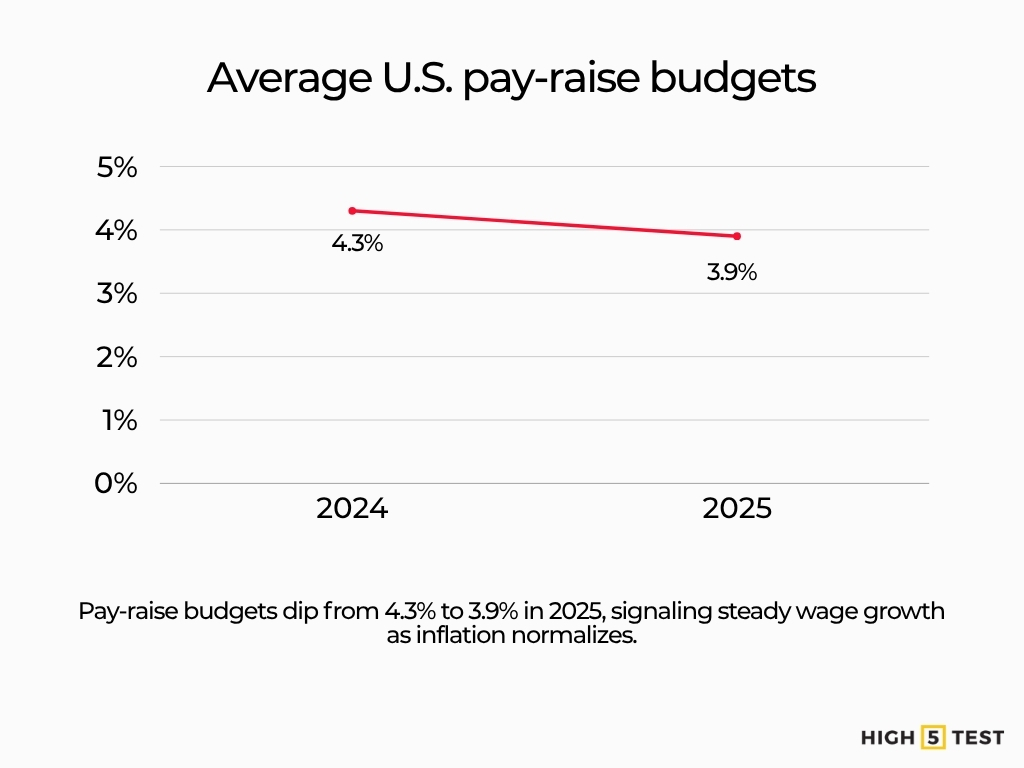
Source: The Conference Board
Nearly half (47%) of job seekers expect salary ranges in postings, proving transparency has become a basic expectation.
Source: Career Plug
70 percent of organizations that include pay ranges in their job postings report that it has resulted in more applications, suggesting visible pay beats guesswork every time.
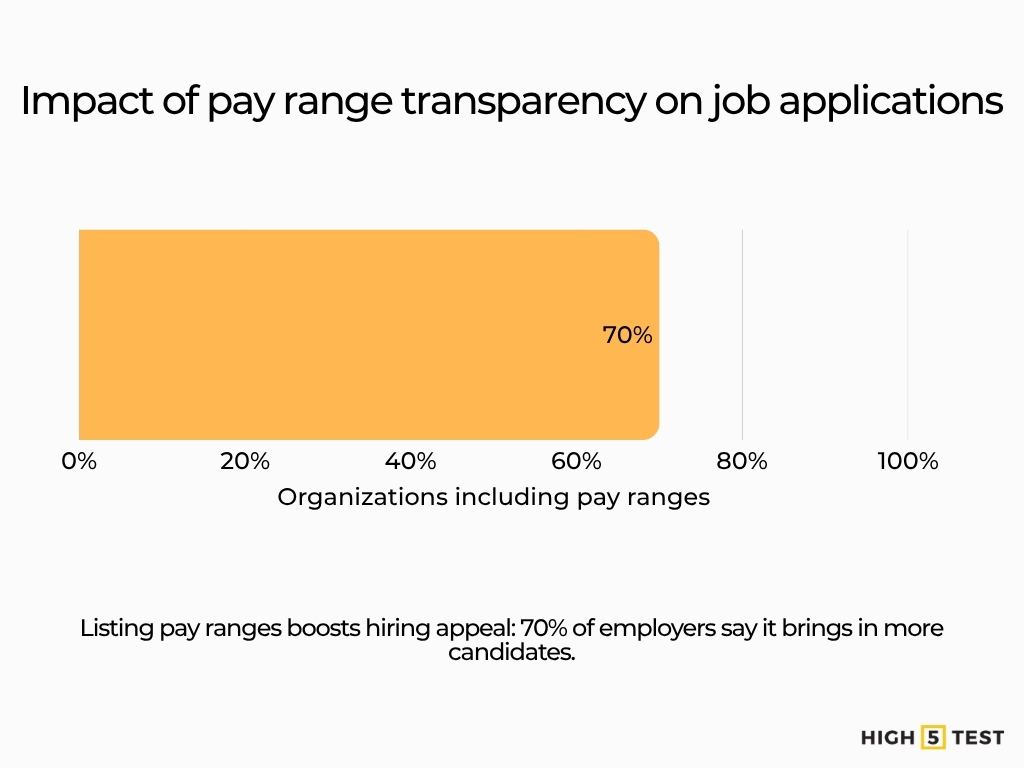
Source: SHRM
20.5% of job changers cited unsatisfactory pay as the main reason for leaving, reaffirming compensation as recruiting’s strongest magnet.
Source: iHire
Recruitment statistics on early talent and young candidates
More than 70% of employers maintained or grew intern programs in 2024, signaling renewed investment in early talent.
Source: NACE
Intern-to-full-time conversion rates averaged 62%, confirming internships as high-ROI pipelines.
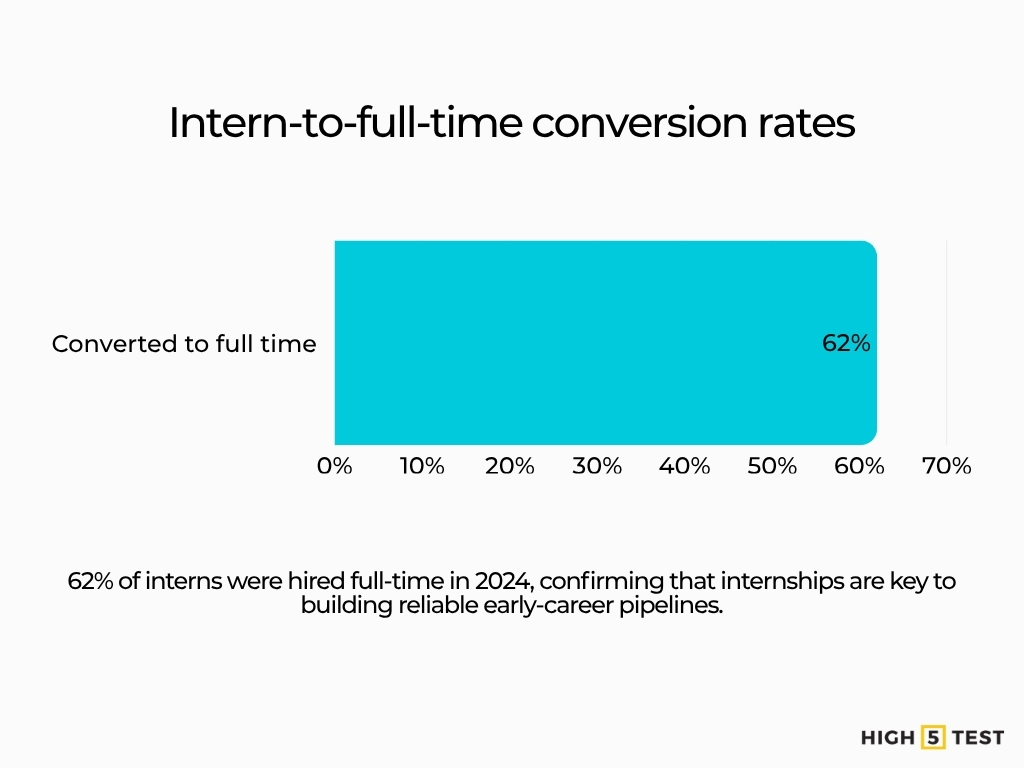
Source: NACE
Average starting salaries for 2024 graduates hit $65,677, showing continued upward pressure on entry-level pay.
Source: NACE
Stats on employee retention
70% of employees are open to new opportunities, meaning passive candidates now outnumber active job seekers.
Source: Randstad
Forty-two percent of quits could be prevented with better management, highlighting leadership as the core retention variable.
Source: Gallup
Replacing an employee costs 50-200% of their annual salary, making turnover the most expensive recruiting metric.
Source: SHRM
31% of new hires leave within the first six months, proving that onboarding quality determines longevity.
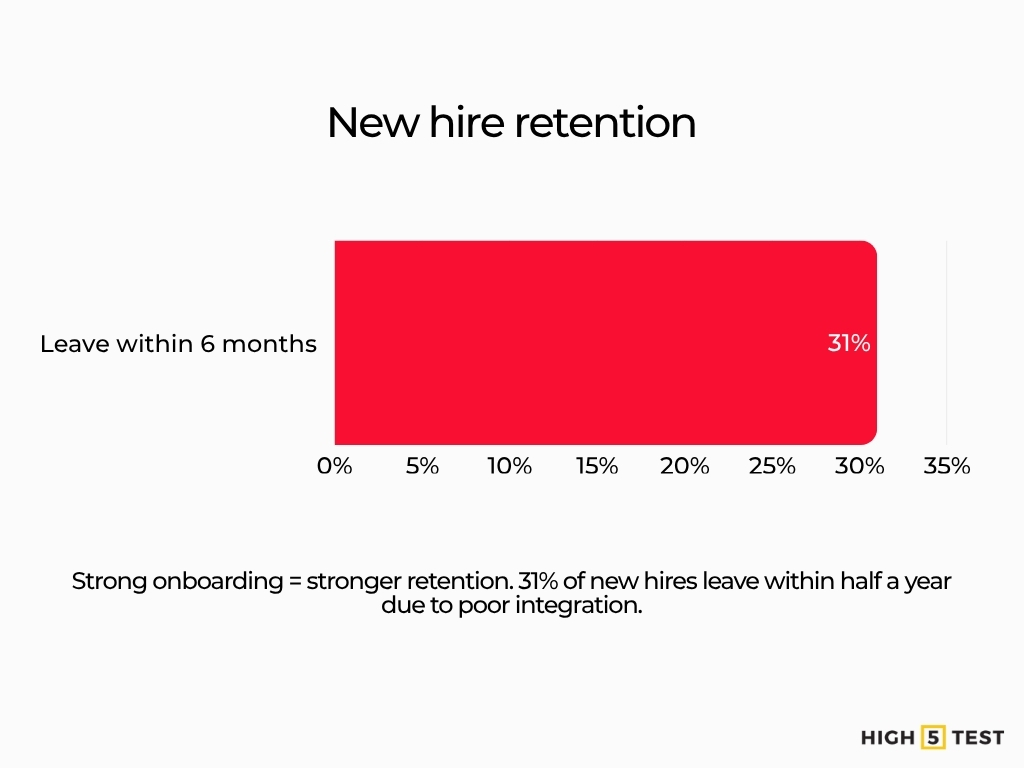
Source: Bamboo HR
Future outlooks in recruitment
A moderate hiring growth through 2026 is expected, suggesting stability rather than expansion.
Source: Envisage Recruitment
Skills-based hiring can widen candidate pools by 6.1x, shifting emphasis from degrees to competencies.
Source: LinkedIn
A report found that using HR analytics has a significant impact on performance, leading to as much as a 25% increase in business productivity and an 80% increase in hiring efficiency, signaling that data literacy is becoming a core TA skill.
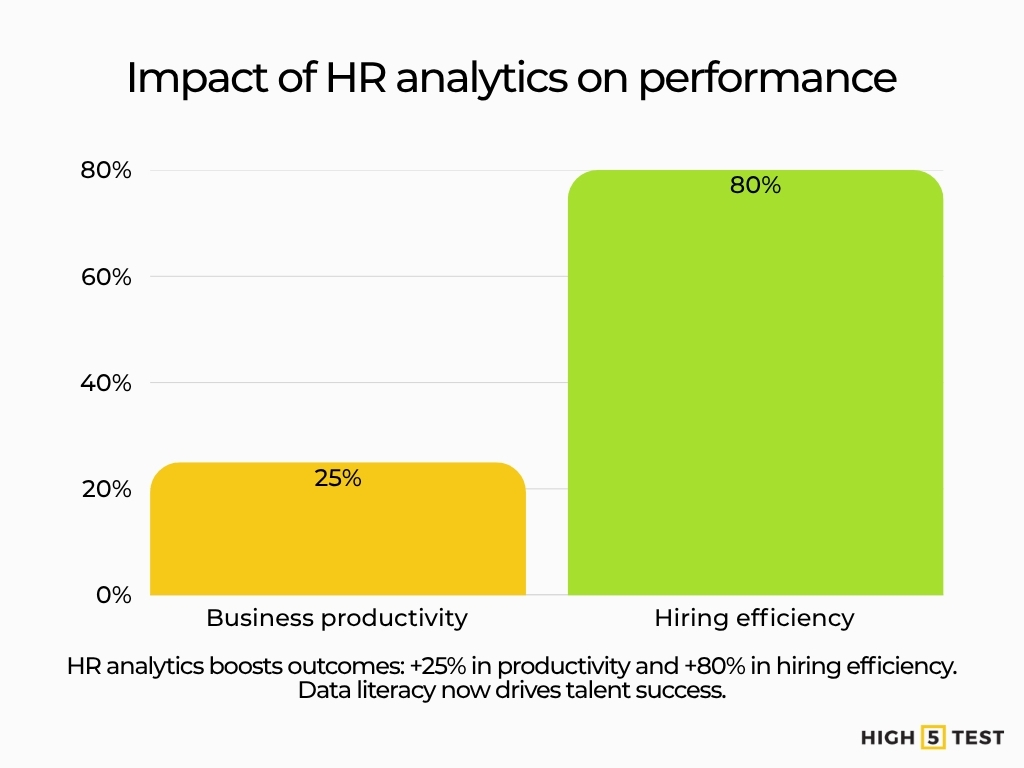
Source: McKinsey
71% of fast-growth agencies rate referrals as “extremely important” to their business and remain the highest-quality of hire, reminding recruiters that human networks still outperform algorithms.
Source: Staffing Hub
Final take
The 2024–2025 hiring environment is tight-but-cooling, slower, and more expensive and the edge belongs to teams that operate like data-driven revenue functions. The playbook is clear: use AI to compress cycle times, make transparency and candidate experience non-negotiable, and anchor brand credibility in measurable inclusion and flexible work. Recruiting isn’t just about filling roles; it’s a compounder of business performance when run with rigor.