Small businesses are the backbone of the American economy, yet many of their key contributions go underappreciated. This article presents up-to-date, research-based statistics on U.S. small businesses for 2024 and 2025, showing their scale, performance, and emerging trends. These numbers give business owners, advisors, investors, and policymakers a clear foundation for decisions.
We explore:
- How many small businesses are there, and how are they structured
- Their economic contribution (jobs, payroll, GDP)
- Business start-ups, growth dynamics, and survival
- Ownership demographics
- Industry and geographic patterns
- Financial health and challenges
- Technology, innovation, and what’s next for 2026
- What does all of this mean for different stakeholders
10 most interesting small business statistics
- Small businesses now exceed 36.2 million in 2025 – a record high.
- 99.9% of U.S. businesses are “small businesses.”
- A staggering 81.9% of all small businesses have no employees.
- Small businesses employ 45.9% of the U.S. workforce – about 59 million people.
- Small businesses generate 43.5% of U.S. GDP.
- In January 2025, the U.S. hit 21 million new business applications – the highest ever recorded.
- From 1995 to 2023, small businesses created 61.1% of all net new jobs.
- Women own ~44.6% of U.S. small businesses; racial minorities own ~22%.
- Professional, scientific & technical services lead with ~4.88 million small businesses (13.5% of the total).
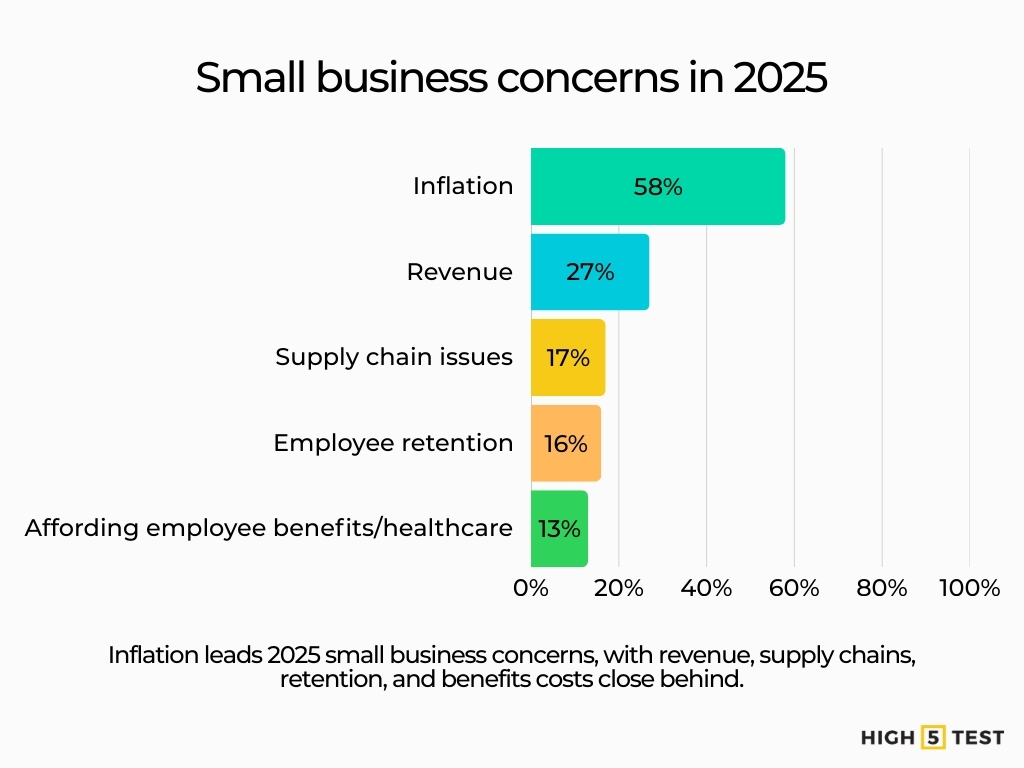
- Inflation is the #1 challenge: 58% of small businesses cite it as their top concern.
20+ Small business statistics in the U.S. (2024-2025)
Total number of small businesses
In 2024, the number of small businesses reached about 34.8 million, about 4.5% higher than the prior year. This growth shows that entrepreneurial activity remains strong even in a mixed economic environment.
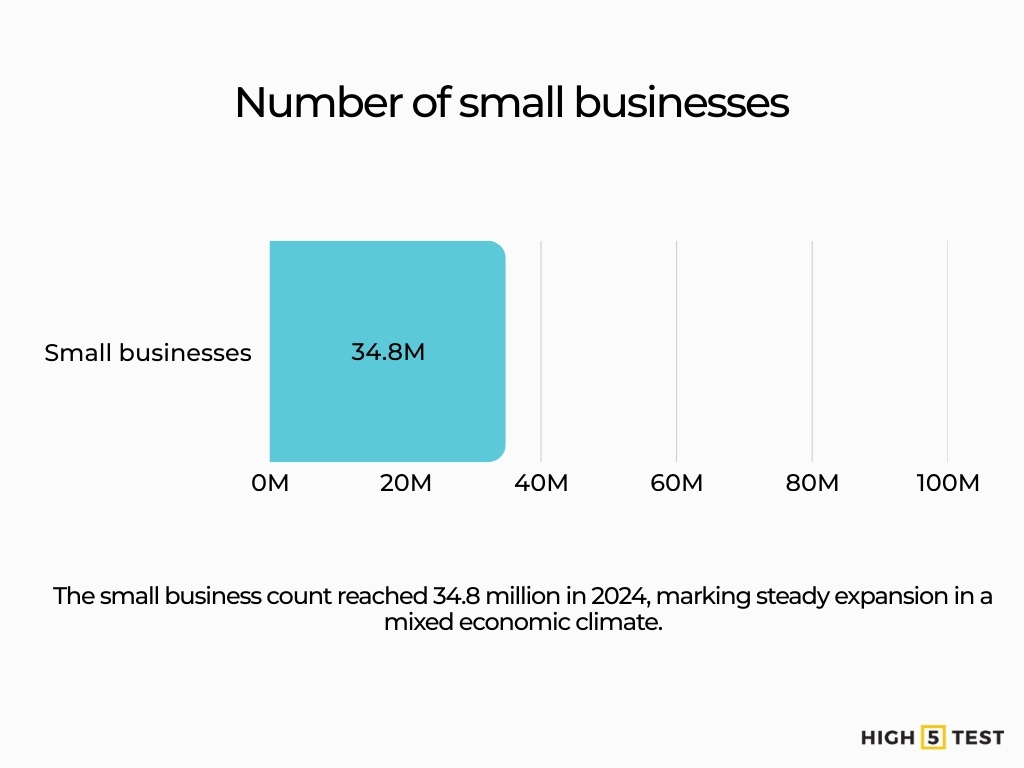
Source: U.S. Small Business Administration – Office of Advocacy
A June 2025 update noted that the number of small businesses exceeds 36.2 million. This jump signals continued formation of new firms and ongoing interest in self-employment and entrepreneurship.
Source: U.S. Small Business Administration – Office of Advocacy
Share of all businesses and definition
Small businesses account for 99.9% of all U.S. businesses. In practice, almost every company in the country falls into the small business category, which shapes how policy and markets affect daily business life.
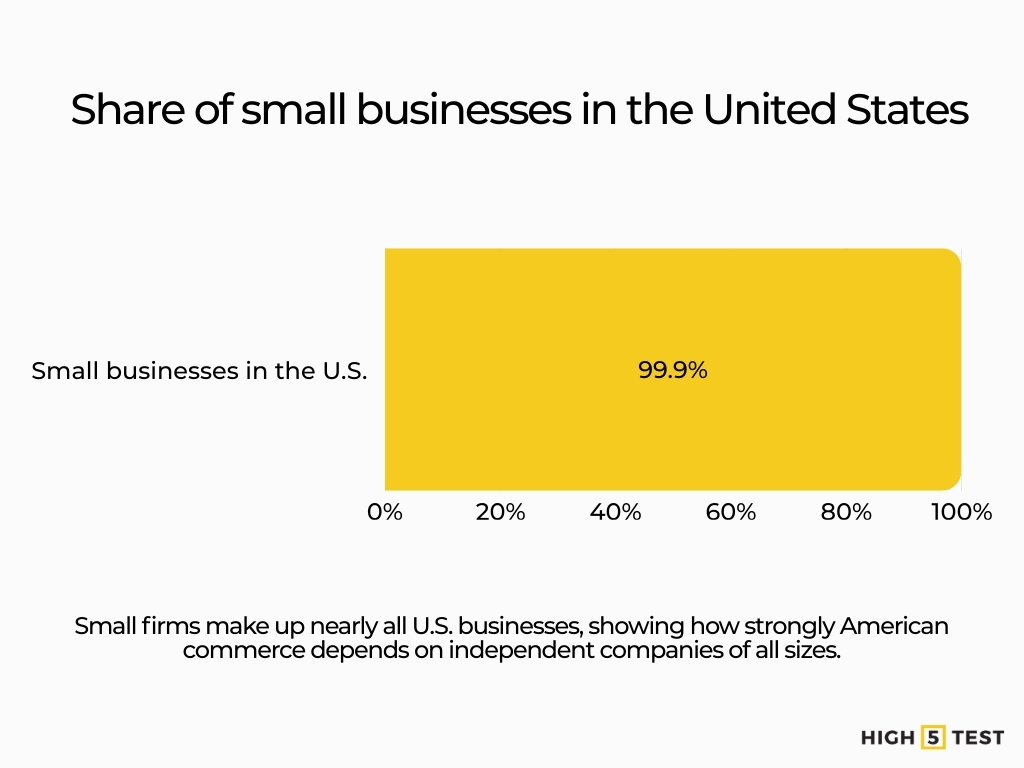
Source: U.S. Small Business Administration – Office of Advocacy
For most research, “small business” means an independent business with fewer than 500 employees. This definition places a wide range of firms under one label, from solo consultants to companies with several hundred workers.
Source: U.S. Small Business Administration – Office of Advocacy
Employer vs non-employer firms
Of the 34.75 million small businesses in 2024, about 81.9% (around 28.48 million) were non-employer firms with no paid employees, while 18.1% (around 6.27 million) were employer firms.
These figures remind us that most small businesses are one-person operations, but the smaller employer segment still supports millions of jobs.
Source: U.S. Small Business Administration – Office of Advocacy
For small employer firms (those with employees), about 49% have just 1–4 workers, 27% have 5–19, 8% have 20–99, and ~1% have 100–499. This structure shows that the typical small employer runs a very lean team and that firms with hundreds of workers sit at the upper edge of the small business definition.
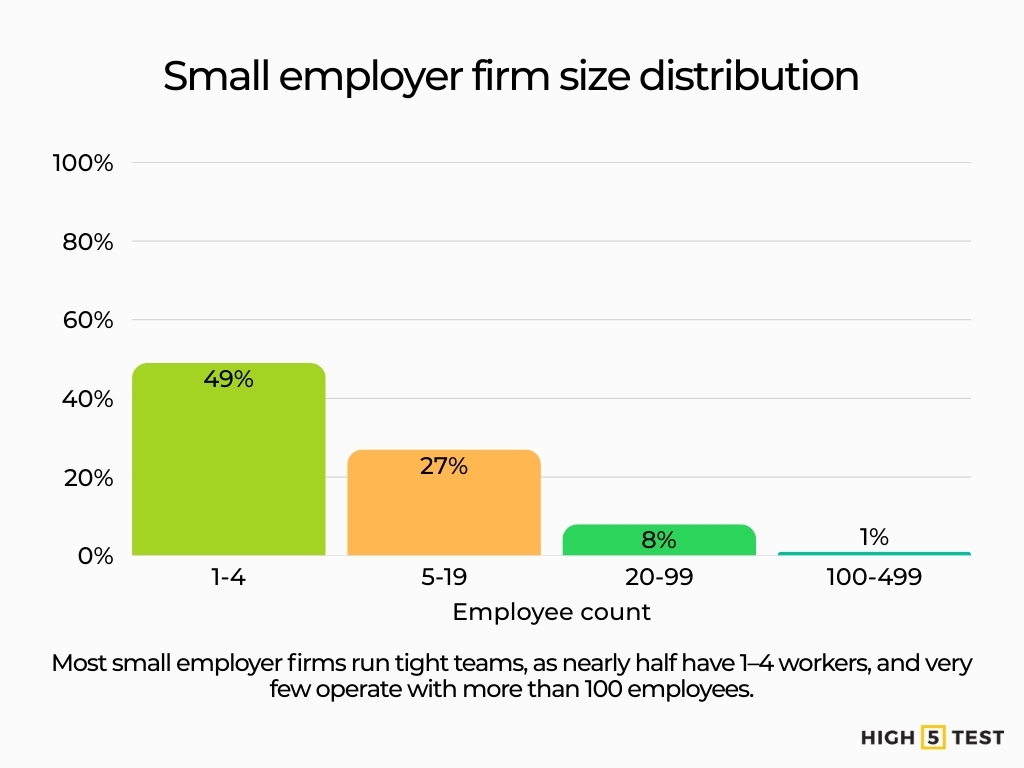
Source: Pew Research Center
What this means
With nearly 35 million small firms in 2024 and more than 36 million in 2025, the sector remains large and growing. The dominance of non-employer firms underscores how many people use small business activity for independent income, while a smaller share of firms carry wider employment and community impact.
Statistics on the economic contribution of small businesses
Employment share
Small businesses employ 45.9% of American workers, or approximately 59 million people. They “employ nearly half of the American workforce.”
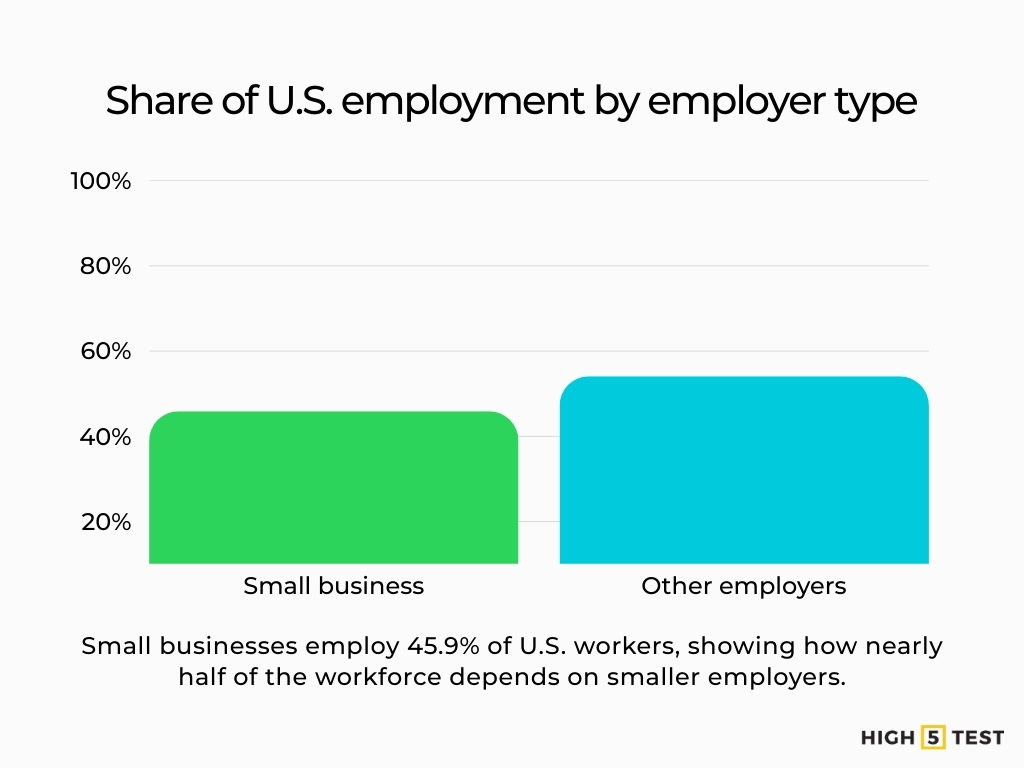
Source: U.S. Small Business Administration – Office of Advocacy, U.S. Chamber of Commerce
Share of GDP and payroll
Small businesses account for about 43.5% of U.S. GDP. Almost half of economic output comes from firms that, on paper, count as “small,” which highlights their importance in national productivity.
Source: U.S. Small Business Administration – Office of Advocacy
They pay about 39% of all private-sector payroll. This share illustrates how wages, household income, and local spending in many communities depend directly on small business performance.
Source: U.S. Small Business Administration – Office of Advocacy
Business dynamics: openings, closings, net growth
Between March 2022 and March 2023, the U.S. recorded around 1.3 million new establishments and about 1.1 million closings, for a net gain of roughly 212,794. This pattern shows that many businesses shut down every year, but new openings still outpace closures.
Source: U.S. Small Business Administration – Office of Advocacy 2024
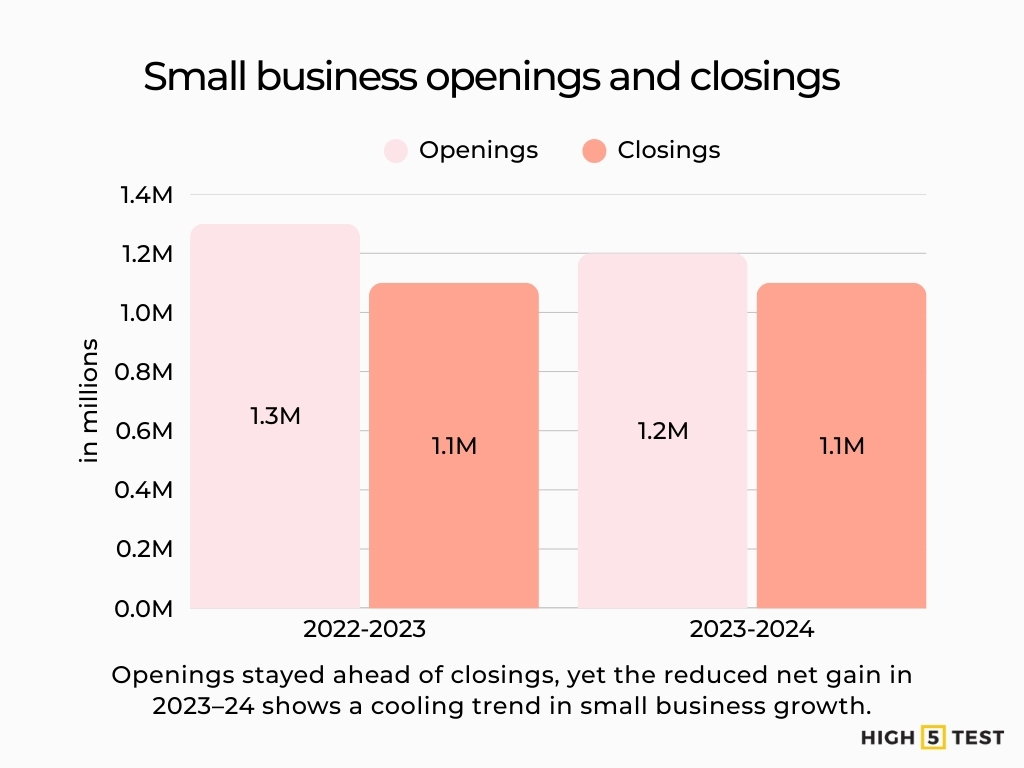
From March 2023 to March 2024, small businesses alone accounted for around 1.2 million openings and 1,125,979 closings, creating a net gain of about 155,311. The slower net increase hints at tougher conditions, even though overall formation continues to expand the small business base.
Source: U.S. Small Business Administration – Office of Advocacy 2025
What this means
Small businesses are numerous and central to jobs and output, and they experience steady churn as firms open and close each year. Net gains remain positive, yet the constant turnover highlights the need for resilience, planning, and supportive policy.
Job creation and business start-ups
New business applications
In January 2025, the U.S. reached a record of about 21 million new business applications. This surge suggests that many people still see opportunity in starting companies despite economic uncertainty.
Source: U.S. Small Business Administration
Net job creation
From 1995 to 2023, small businesses generated roughly 20.2 million net new jobs, equal to about 61.1% of all net new jobs in that period. Over time, this pattern confirms that small businesses act as the primary engine of job growth in the United States.
Source: U.S. Small Business Administration
What this means
High volumes of business applications and long-term net job contributions point to a dynamic entrepreneurial base. For workers and communities, this means that future employment growth will likely depend heavily on small firms and new ventures.
Demographics of small business ownership
Ownership by gender and minority status
Women own approximately 44.6% of U.S. small businesses. Racial minorities own about ~22% of U.S. small businesses. This share shows that women and racial minorities now hold a substantial presence in entrepreneurship, even as access to capital and networks still needs improvement in many areas.
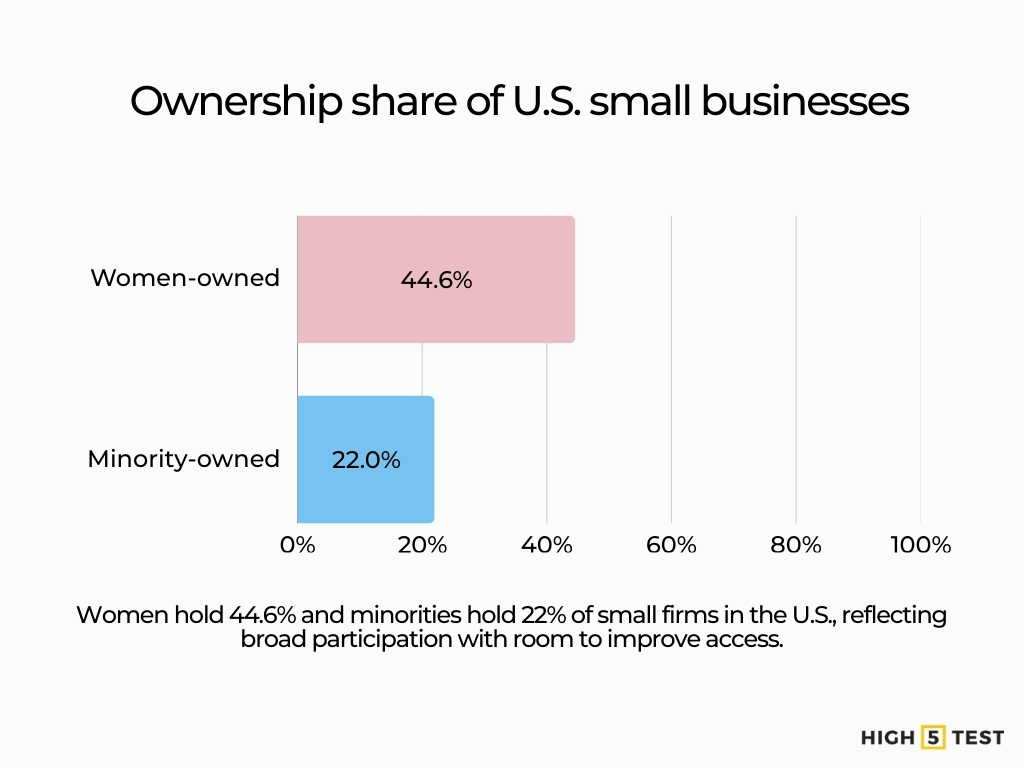
Source: U.S. Small Business Administration, Pew Research Center
Owner age/generation
Among owners, Gen X accounts for about 49%, Baby Boomers for 30%, and Millennials for 21% of small business ownership. These figures indicate that mid-career and older founders still dominate ownership, but younger entrepreneurs are steadily increasing their share.
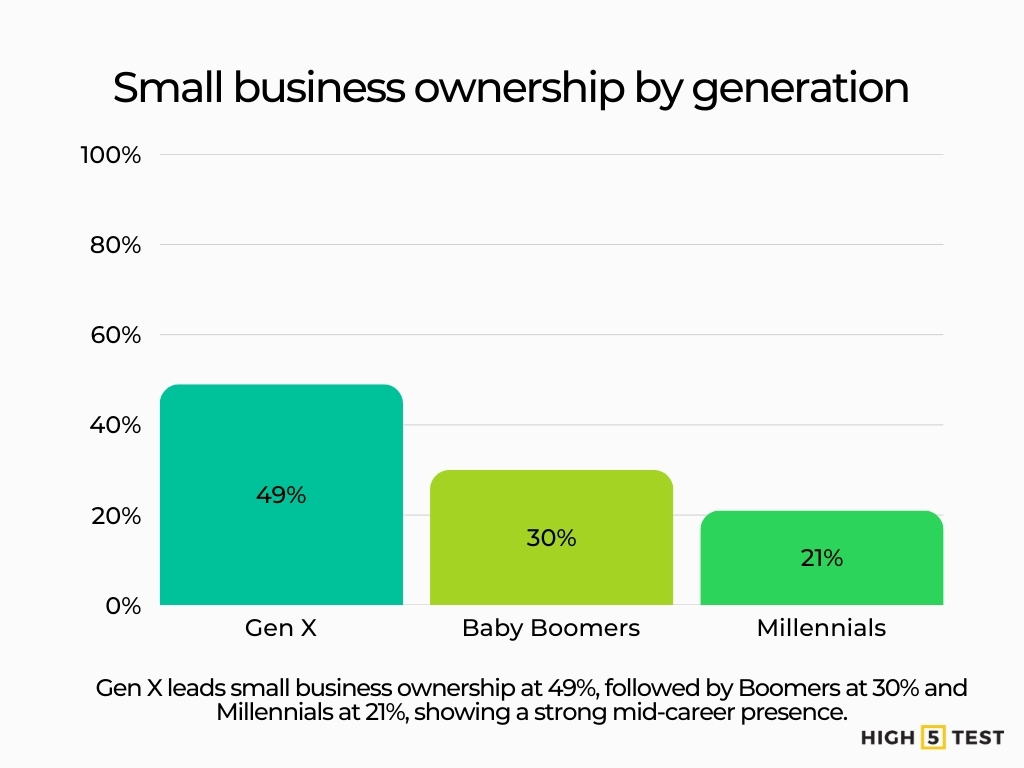
Source: Guidant Financial
What this means
Small business ownership includes a wide mix of genders, racial backgrounds, and generations, though gaps remain in representation and resources. Targeted support for underrepresented founders and aging owners alike can influence succession, growth, and community outcomes.
Statistics on industry sectors and geographic distribution
Industry breakdown
In the professional, scientific, and technical services industry alone, there are ~4.88 million small businesses, representing ~13.5% of all small businesses. This concentration highlights how knowledge-based work and services form a major pillar of the small business economy.
Source: U.S. Small Business Administration
In manufacturing, small business manufacturers (0–499 employees) employed ~4.8 million workers, and small firms represent about 98% of all manufacturing firms. These numbers show that production in many communities still depends heavily on smaller manufacturers, not just large plants.
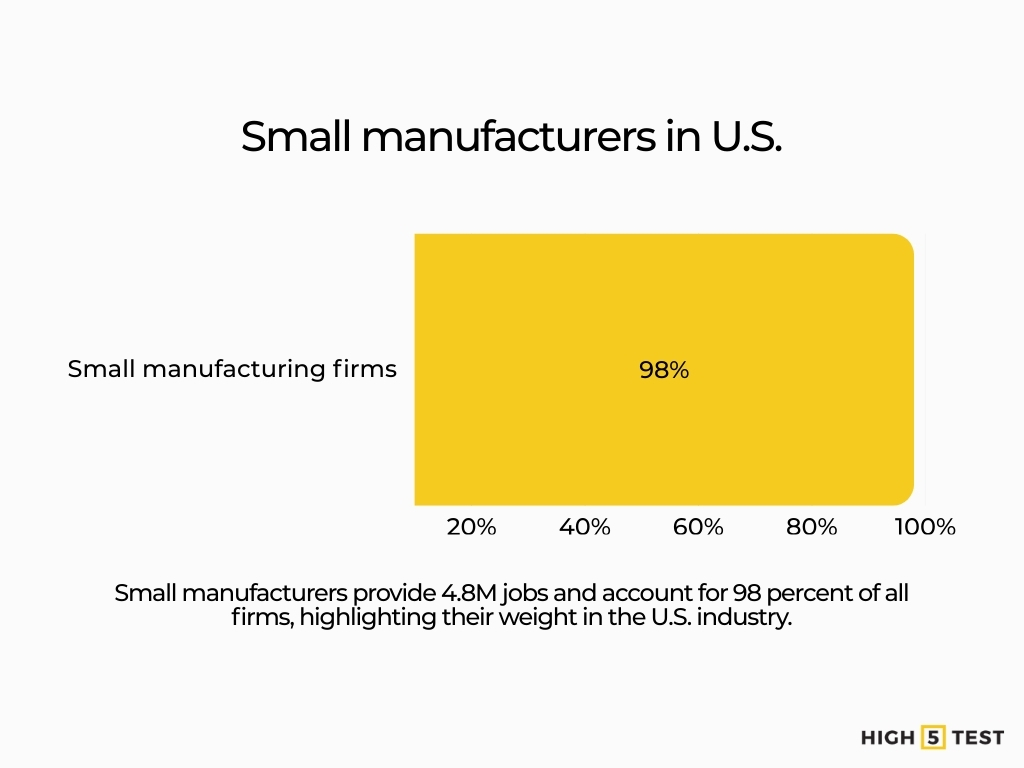
Source: U.S. Small Business Administration – Office of Advocacy
Geographic and state concentration
California had around 4.3 million small businesses in 2025, equal to roughly 12% of the U.S. total. This makes California a standout hub for small firms, driven by its population size, diverse industries, and entrepreneurial culture.
Source: U.S. Small Business Administration – Office of Advocacy
The New York–Newark–Jersey City metro area hosts about 2.6 million small businesses, the highest count for any metropolitan region.
This density of firms reflects the region’s large market, varied industries, and long history of commerce and services.
Source: U.S. Small Business Administration – Office of Advocacy
What this means
Small business activity differs widely across industries and regions, with strong clusters in services, manufacturing, and large coastal markets. Owners, investors, and policymakers benefit from understanding where concentrations occur, since local conditions shape supply chains, labor markets, and growth options.
Financial health, profitability, and challenges
Access to capital and lending
In fiscal year 2024, small businesses received about 103,000 financings supported by federal programmes, the highest volume since 2008, with a total capital impact of roughly 56 billion dollars, an increase of around 7% over 2023. This growth hints at somewhat improved access to funding for expansion, equipment, and working capital.
Source: U.S. Small Business Administration
Common challenges
While precise nationwide percentages for 2025 challenges vary in source reliability, many small businesses cite inflation (58%), revenue (27%), supply chain issues (17%), employee retention (16%), and affording employee benefits/healthcare (13%) among top concerns.
Source: U.S. Chamber of Commerce
What this means
Capital access appears to be moving in a positive direction, yet many small businesses still face financial stress from inflation, wages, and supply disruptions. Owners, lenders, and policymakers need to monitor both financing availability and cost pressures to keep more firms on a stable footing.
Technology, innovation, and future trends
Digital and technology adoption
Small businesses are expected to put more focus on AI agents, cybersecurity, digital commerce, supply chain resilience, and automation. This shift means that even very small firms will increasingly rely on software and data tools to stay competitive.
Source: Forbes
Outlook and opportunities
Key themes for 2025 include:
- Wider use of digital tools and platforms to reach customers online
- Greater emphasis on agility, resilience, and flexible or hybrid workforce models
- Continued growth in new business formation and entrepreneurship
- Ongoing regulatory and capital market changes that can limit small business financing
These themes point to a future in which technology and financial conditions strongly influence who grows and who falls behind.
Conclusion
Top small business trends for 2026 will likely center on AI adoption, access to capital, operational agility, and expansion of digital commerce. Firms that commit to automation, e-commerce, and disciplined financial management are better positioned to grow, while slower adopters face a higher risk of losing ground in an increasingly data-driven economy.
Overall, the 2025 outlook for small businesses remains cautiously positive, with many openings for entrepreneurs who adapt to shifting consumer preferences and economic conditions. Owners who stay focused on innovation, resilience, and digital readiness give themselves a stronger chance of long-term success.
Small businesses still make up nearly all U.S. firms, employ close to half of workers, and contribute a large share of GDP and payroll, even though many are solo operations. The data shows a mix of opportunity and risk, so owners and advisers can use these insights to refine strategy, funding choices, and technology use, while investors and policymakers expand access to capital, skills, and digital infrastructure so small firms continue to drive jobs and growth.