Employee benefits are no longer just a “nice-to-have” perk as they are a core component of total compensation and a decisive factor in employee attraction, retention, and engagement. In the United States, benefits now account for nearly one-third of total employer compensation costs, while rising healthcare expenses, evolving workforce expectations, and competitive labor markets continue to reshape benefit strategies.
This research compiles the most important, most surprising, and most valuable employee benefits statistics for 2024 and 2025, using only primary, authoritative sources. The data below provides a clear, evidence-based snapshot of how benefits impact both employers and employees and why benefits strategy has become a critical business decision.
10 most interesting employee benefits statistics
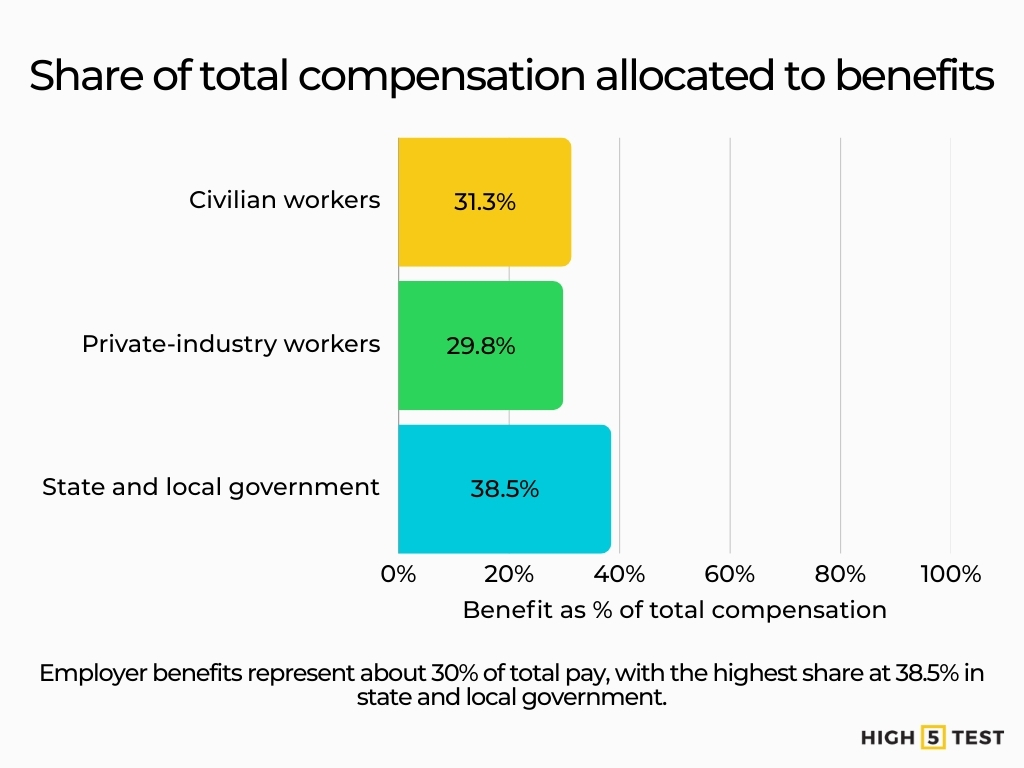
- Employee benefits account for nearly one-third of total compensation: U.S. civilian workers’ total compensation averaged $48.05 per hour, with $15.03 (31.3%) allocated to benefits.
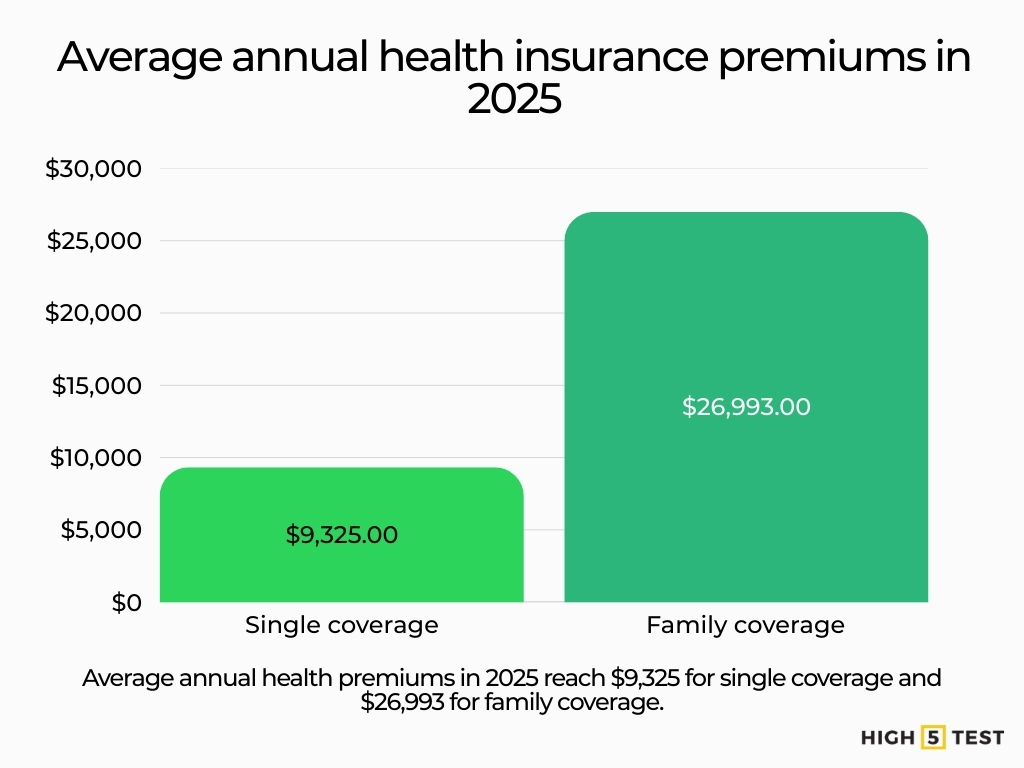
- Healthcare premiums remain high: In 2025, average annual premiums were $9,325 for single coverage and $26,993 for family coverage, highlighting the enormous cost burden on employers and employees.
- Workers shoulder significant cost sharing: Employees contribute about 16% toward single coverage premiums and 26% toward family coverage, which continues to rise in absolute dollars.
- High deductibles affect care: 34% of covered workers face deductibles of $2,000 or more for single coverage, meaning substantial out-of-pocket risk for many.
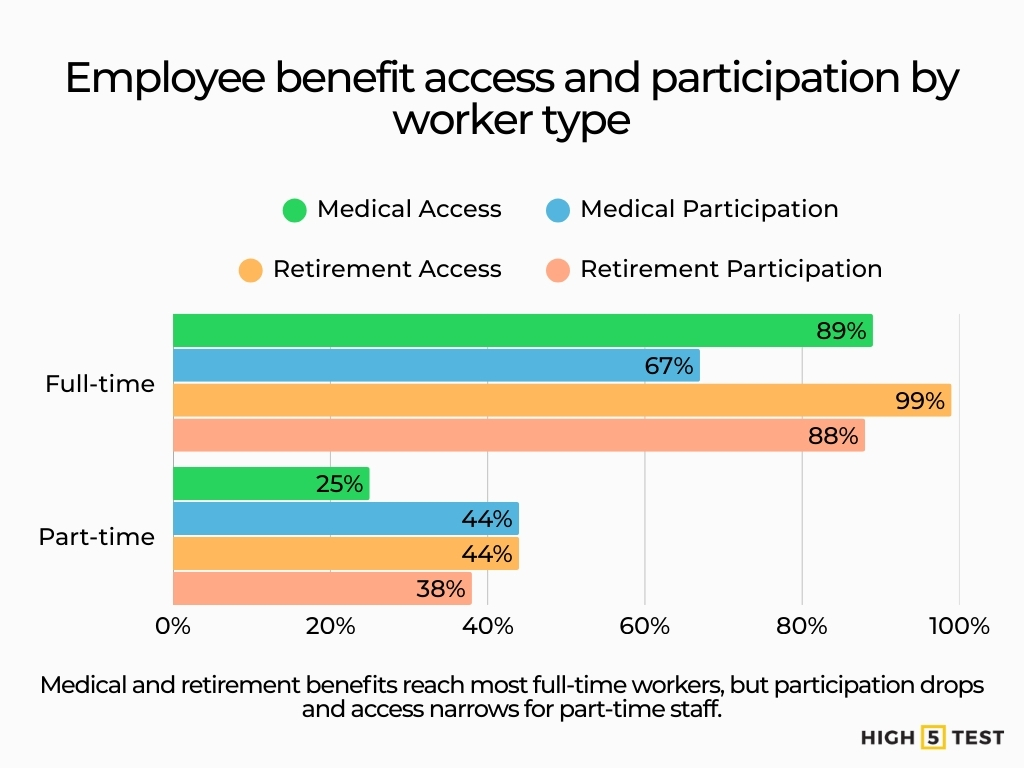
- Benefits access varies sharply by employment type: While 89% of full-time workers have access to medical benefits, only 25% of part-time workers do – a stark coverage gap.
- Retirement plans remain widespread: 99% of full-time employees have access to retirement benefits, with 88% participating – one of the highest participation rates among major benefit categories.
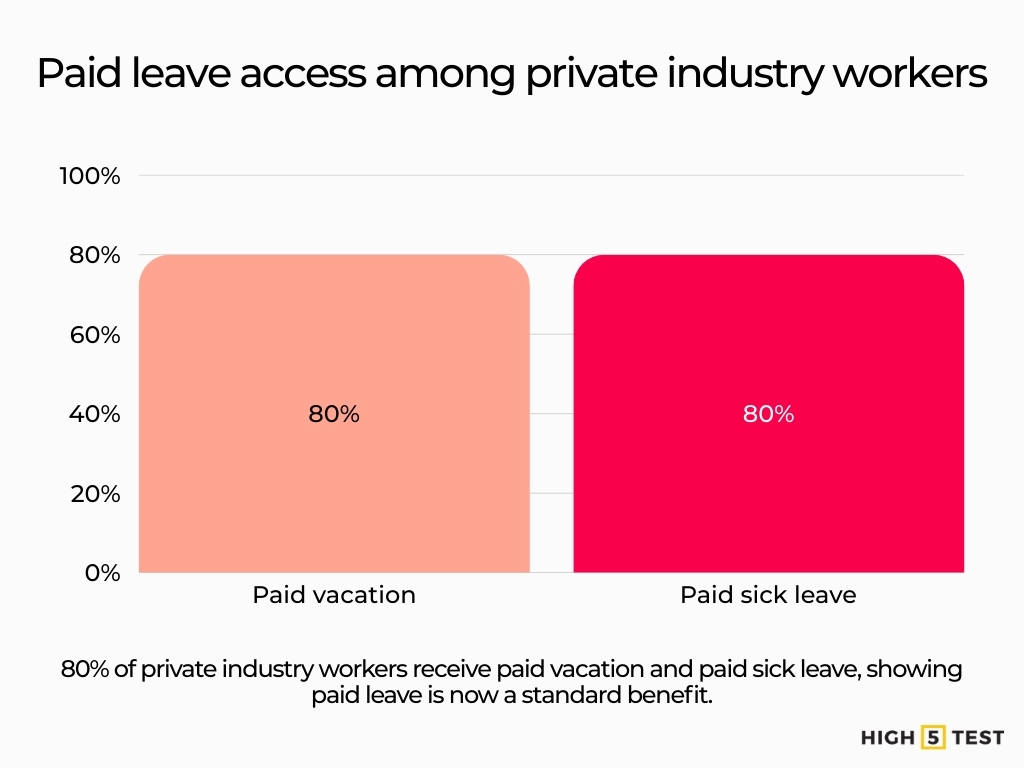
- Paid leave is broadly available, but uneven: 80% of private-industry workers have access to paid vacation and paid sick leave, but access ranges from 55% in leisure/hospitality to 97% in finance/info sectors.
- Health benefits rank highest in employer priorities: 88% of employers rate health-related benefits as extremely or very important, reinforcing healthcare’s central role in benefits strategy.
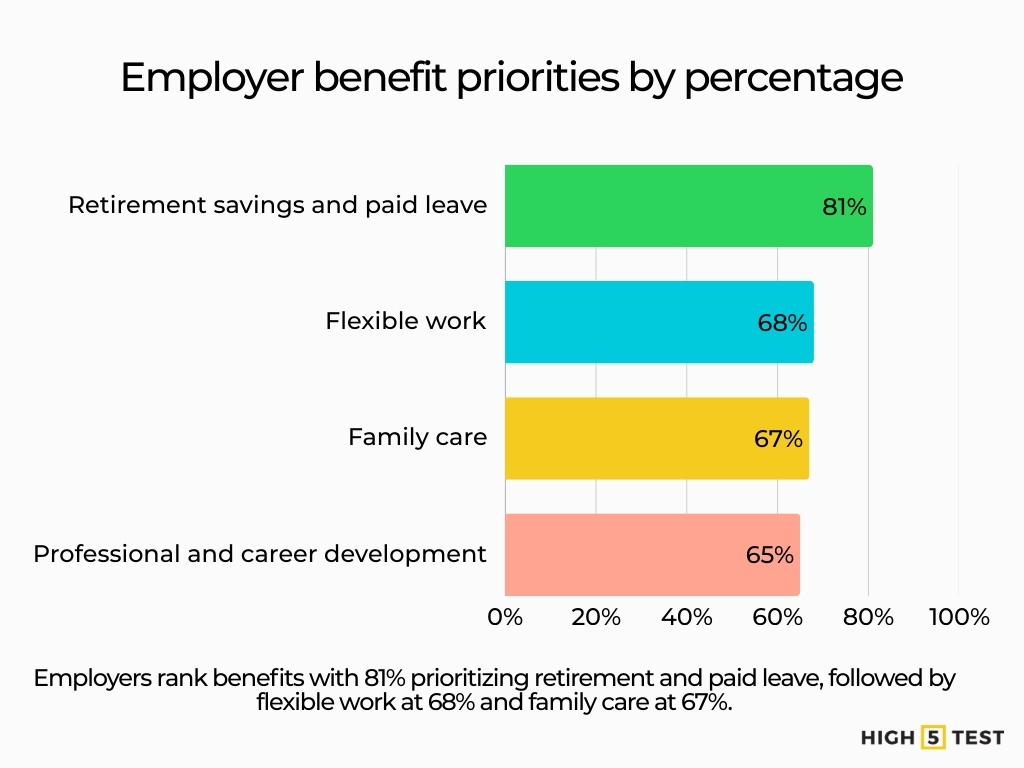
- Flexible work and family care are emerging priorities: A majority of employers prioritize flexible work (68%), family care benefits (67%), and professional development (65%), signaling benefits beyond the basics are gaining traction.
- Benefit cost growth still outpaces wages: Benefit costs grew 3.8% year-over-year, slightly higher than wage growth, meaning employers face rising total compensation pressure from both benefits and salaries.
30+ employee benefits statistics in the U.S. (2024/2025)
Employer spending per hour
Total compensation for civilian workers averaged $48.05 per hour, with $15.03 (31.3%) allocated to benefits.
This confirms that benefits consistently account for nearly one-third of employer labor costs. Any benefits strategy discussion must start with the reality that benefits are a structural expense, not a discretionary perk.
Private-industry workers received $45.65 per hour, with 29.8% spent on benefits.
Private employers tend to spend a smaller share on benefits than government employers. Part-time eligibility limits and more variable pay often explain the gap.
State and local government workers averaged $63.94 per hour, with 38.5% devoted to benefits.
Public sector packages often include stronger retirement and health plans, which help explain long tenure in many government jobs.
Source: U.S. Bureau of Labor Statistics (BLS)
Statistics on employee health insurance costs and coverage
Average annual premiums reached $9,325 for single coverage and $26,993 for family coverage in 2025.
Health coverage remains the largest benefit expense for many employers. Family premiums can strain budgets fast, especially in roles with lower wages.
Workers contributed approximately 16% of single and 26% of family premiums.
Cost-sharing has stabilized in percentage terms, but absolute dollar contributions continue to rise, increasing financial strain on employees even when employer generosity remains constant.
34% of covered workers faced deductibles of $2,000 or more for single coverage.
High deductibles shift more upfront costs to employees. That can lead to delayed care and frustration, even among people who technically have coverage.
Source: Kaiser Family Foundation (KFF)
Data on employee benefit access and participation rates
Medical and retirement benefits access
89% of full-time civilian workers had access to medical benefits, while only 67% participated.
The difference between access and enrollment often comes down to affordability and household budget pressure.
Only 25% of part-time workers had access to employer-provided health benefits, and the take-up rate was 44%.
This keeps part-time workers in a separate tier of coverage, which can affect engagement and turnover.
99% of full-time workers had access to retirement benefits, with 88% participating, while 44% of part-time workers had access and 38% participated.
Retirement plans remain one of the most common and most used benefits in full-time roles. Access is improving in some sectors, but participation still depends on hours, pay levels, and plan design.
Source: U.S. Bureau of Labor Statistics (BLS)
Statistics on employees’ paid leave benefits
80% of private-industry workers had access to paid vacation, and 80% also had paid sick leave.
Paid leave has become a baseline expectation rather than a differentiator, but disparities persist by income level and occupation.
Access to paid sick leave ranged from 55% in leisure and hospitality to 97% in finance and information industries.
Leave access often tracks with job quality and industry norms, which can widen employee experience gaps within the same labor market.
Source: U.S. Bureau of Labor Statistics (BLS)
Data on employer benefit priorities
88% of employers rate health-related benefits as extremely or very important.
Health benefits stay at the center of benefit strategy because employees expect them, and labor markets reward employers that offer strong options.
81% of employers identify retirement savings and paid leave as top benefit priorities, 68% prioritize flexible work, 67% focus on family care, and 65% emphasize professional and career development.
This mix shows a move toward benefits that support stability, time, and long-term planning.
31% of employers offer paid family caregiving leave.
Caregiving benefits are still limited. Employers that offer them can stand out, especially in talent markets with older workers and working parents.
Source: Society for Human Resource Management (SHRM)
Statistics on benefit-cost growth
Benefit costs rose 3.8% year-over-year, compared to 3.5% growth in wages.
Benefits are rising at a pace similar to wages, so total compensation pressure comes from both sides.
Source: U.S. Bureau of Labor Statistics (BLS)
What do these statistics mean for employers?
- Benefits now represent ~30% of total compensation, so small changes can have a large budget impact.
- Healthcare remains the dominant cost driver, with family coverage carrying the largest burden.
- Access gaps persist for part-time and lower-wage workers, influencing engagement and turnover.
- Core benefits such as health coverage, retirement plans, and paid leave tend to deliver more perceived value than many short-term perks.
Conclusion
The data is clear: employee benefits are one of the largest investments employers make and one of the strongest signals employees use to judge job quality. With benefits accounting for roughly 30% of total compensation, healthcare premiums exceeding $26,000 for family coverage, and significant gaps in access for part-time and lower-wage workers, benefits strategy directly affects cost control, workforce stability, and employee well-being.
As organizations plan for 2025 and beyond, the most successful employers will be those that optimize core benefits first, healthcare, retirement, and paid leave, while aligning offerings with employee needs and financial realities. Understanding these employee benefits statistics allows leaders to make smarter, data-driven decisions that balance cost, compliance, and competitive advantage in an increasingly benefits-driven labor market.