Hybrid work in the US has shifted from a temporary response to a long-term operating model. Many employers now treat it as a standard way of working rather than an exception.
The data shows steady participation, clear employee preferences, and more structured office expectations. Results vary based on how hybrid work is measured, so definitions matter. This report brings together reliable US-focused data from 2024 and 2025, with global context included only when it adds clarity.
10 most interesting hybrid working statistics
- 22.9% of all people at work in the US (35.5 million workers) teleworked or worked at home for pay in Q1 2024, up from 19.6% a year earlier – showing that working from home is still expanding at the population level.
- 33% of employed Americans worked from home on the days they worked in 2024, meaning one in three US workers used some form of hybrid or remote work during the year.
- Hybrid work remains the dominant model for remote-capable employees, but its share declined from 55% in November 2024 to 51% in May 2025, signaling stabilization rather than collapse.
- Fully on-site and fully remote work both grew by roughly 2 percentage points in 2025, suggesting polarization at the edges, but hybrid still holds the center.
- Hybrid jobs made up 13.4% of all US job postings in July 2024, compared to just 8.5% for fully remote roles, confirming that hybrid is more common than fully remote in employer demand.
- Only 7.8% of US job postings advertised remote or hybrid work by October 2024 on Indeed, highlighting how job-board methodology dramatically changes “remote work” headlines.
- Around 60% of remote-capable employees prefer hybrid work, while fewer than 10% want to work fully on-site — a preference pattern that has remained remarkably consistent over multiple years.
- 62% of managers say hybrid or remote teams are more productive than fully in-office teams, directly contradicting the idea that office presence automatically improves performance.
- US office buildings averaged only ~54% occupancy in early 2025, with major cities like San Francisco falling below 45%, underscoring how far the workplace has shifted from pre-pandemic norms.
- 64% of workers say their employers are encouraging the use of AI at work in 2025, linking the future of hybrid work to technology enablement rather than location alone.
Definitions (so the stats don’t get mixed up)
- Hybrid work refers to a schedule that mixes office and remote days. Most plans require one to four days in the office each week.
- Telework or work at home for pay is a Bureau of Labor Statistics measure. It tracks any paid work done at home during a reference period.
- Worked at home on days worked comes from the American Time Use Survey. It records any work performed at home on a workday, even for a short period. This explains why it often shows higher participation than other surveys.
20+ hybrid working statistics in the U.S. (2024/2025)
Workforce level work-from-home participation
These figures include all forms of paid work done at home and overlap heavily with hybrid arrangements.
Q1 2024: 22.9% of people at work teleworked/worked at home for pay. This equals 35.5 million workers. This shows that working from home remains a normal part of the US labor market. Participation has grown compared to the prior year, which signals stability rather than decline.
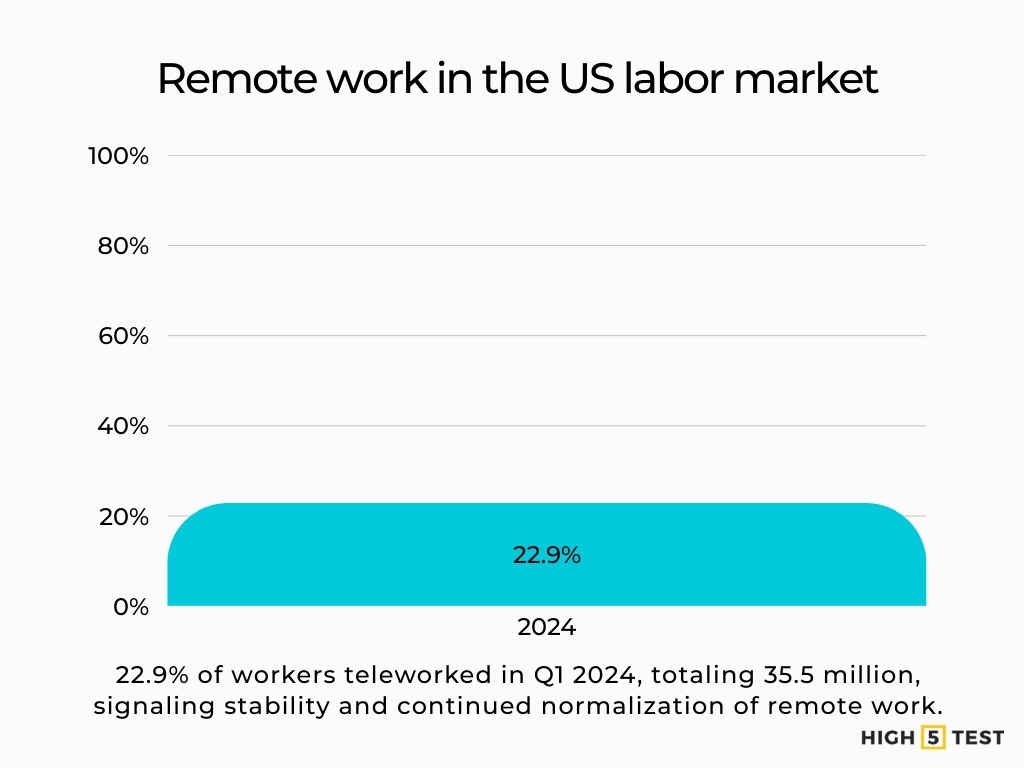
Source: U.S. Bureau of Labor Statistics – Telework Trends
2024: 33% of employed people worked at home on days worked. This figure captures partial days and informal flexibility. It highlights how many workers blend home and office time, even if they are not formally classified as hybrid.
Source: U.S. Bureau of Labor Statistics – American Time Use Survey
Men reported a lower share of working at home on days worked at 29%, while women reported 36%. The difference reflects job types, caregiving patterns, and schedule flexibility.
Source: U.S. Bureau of Labor Statistics – American Time Use Survey
Remote-capable employees: Hybrid vs. fully remote vs. fully on-site
This view aligns closely with how employers design workplace policies, especially in knowledge-based roles.
Nov 2024 → Nov 2025: Hybrid among remote-capable US employees declined from 55% to 52%. The shift suggests tighter scheduling requirements, not a rejection of hybrid work. Many employees remain on mixed schedules despite policy adjustments.
Over the same period, fully on-site increased by ~2 percentage points (19% → 21%), and fully remote remained the same at 26%. Stability here indicates that employers who allow full remote work are not reversing course at scale.
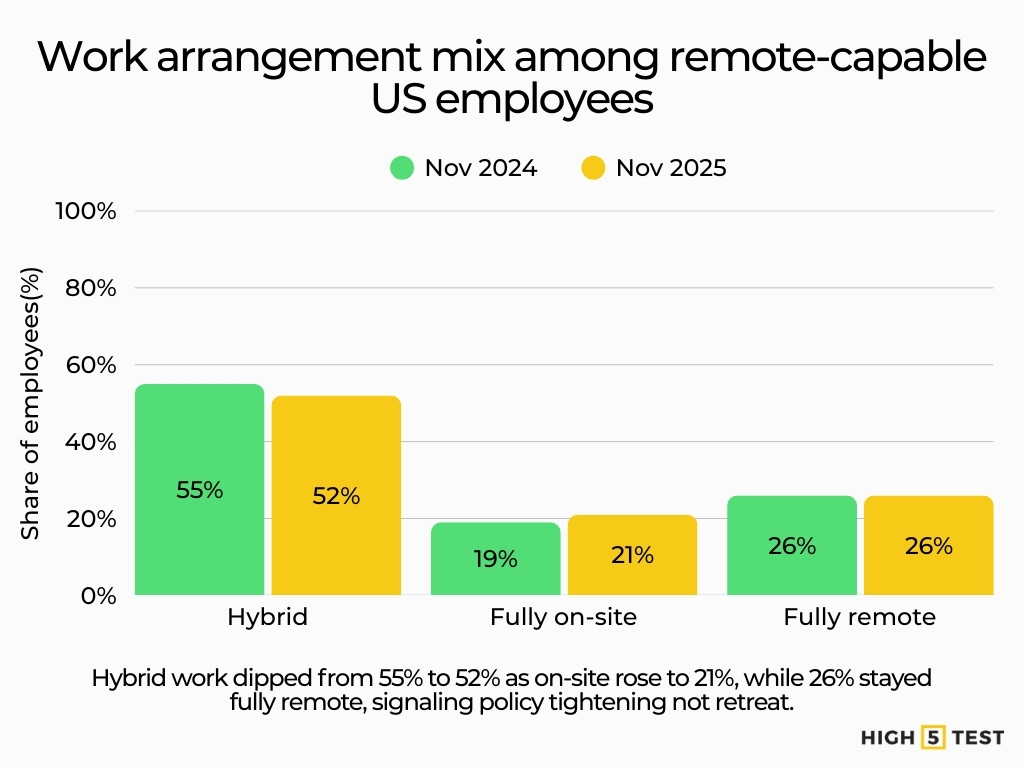
Source: Gallup
How much of the work is actually done from home?
Some research focuses on how much work time happens at home rather than on scheduled labels.
Across major US surveys in 2023, work from home averaged about 25% of full workdays. This confirms that hybrid work usually means a minority of time at home rather than equal splits.
Source: WFH Research (Aksoy, et. al.)
Other studies place the share anywhere from 15% to more than 35%. The gap comes from differences in survey methods and definitions, not from conflicting trends.
Source: NBER Research (Buckman, et. al.)
Hybrid job market statistics
Job postings reflect current employer intent, even if they do not match total employment.
LinkedIn Economic Graph (hybrid vs. remote)
July 2024: 13.4% of US job postings were hybrid, and 8.5% were remote.
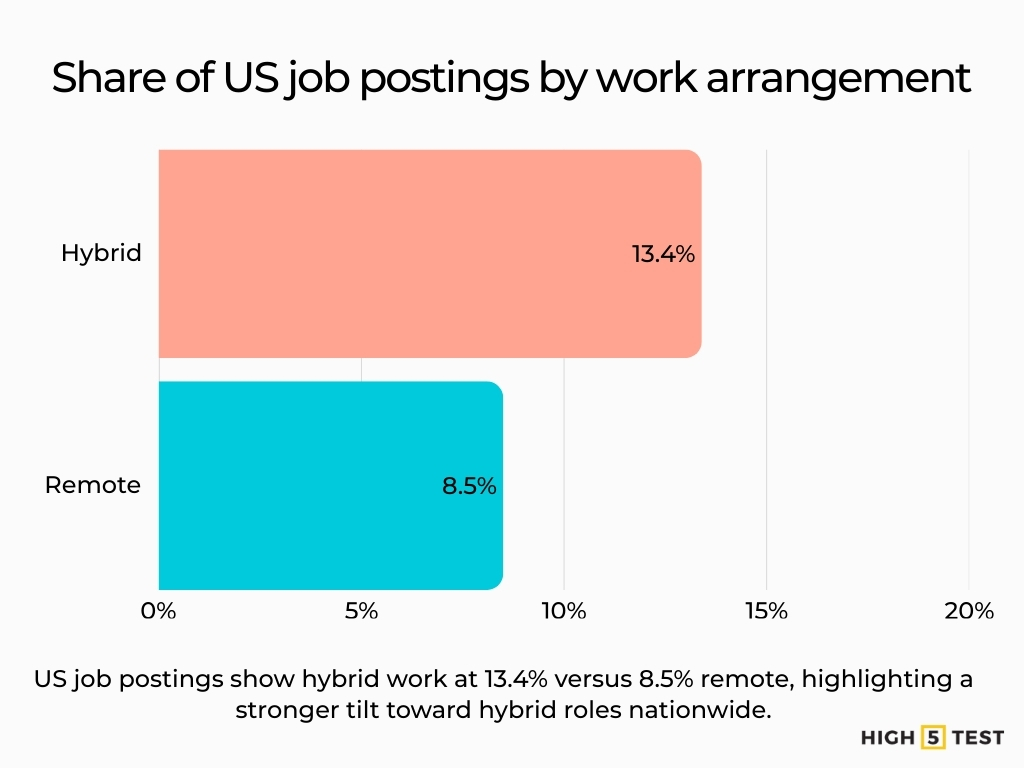
Source: LinkedIn Economic Graph
Roughly one in five open roles offered some form of flexible work. This includes both hybrid and remote options.
Source: LinkedIn Economic Graph
Indeed Hiring Lab (remote/hybrid mentions)
End of Oct 2024: 7.8% of Indeed job postings advertised remote or hybrid work. This lower figure reflects stricter labeling and a focus on explicit mentions rather than informal flexibility.
Source: Indeed Hiring Lab
Data on what employees want
Remote-capable preferences
~60% of remote-capable employees want a hybrid, about one-third prefer fully remote work, and less than 10% prefer to work on-site. Hybrid remains the most popular option because it balances flexibility with in-person connection.
Source: Gallup
Productivity and performance: What managers and workers report
66% of managers say teams are more productive when hybrid/remote, and 98% say they trust their teams to be productive on non-office days. These views suggest that skepticism about remote output has softened with experience.
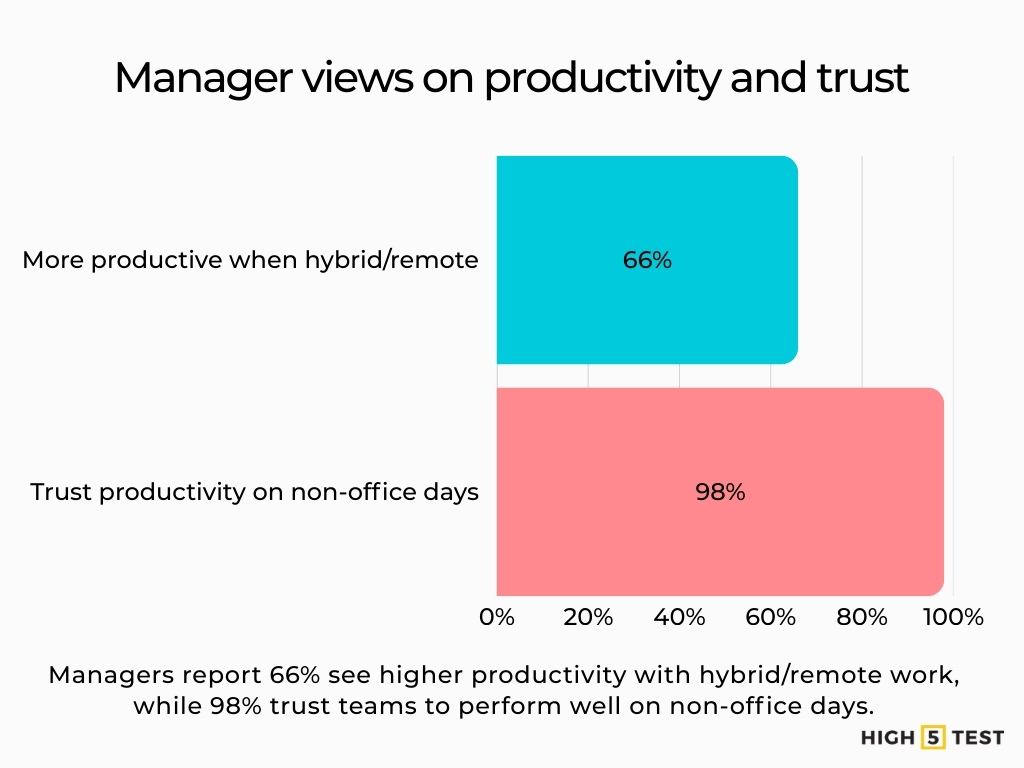
Source: FlexOS
Engagement and well-being: Hybrid vs. remote vs. on-site
Global studies help frame how work location relates to engagement and life satisfaction.
31% of exclusively remote employees reported engagement. Hybrid workers have a 23% engagement rate, which is on par with on-site workers in remote-capable roles. In contrast, on-site positions without remote options report a 19% engagement rate.
Source: Gallup
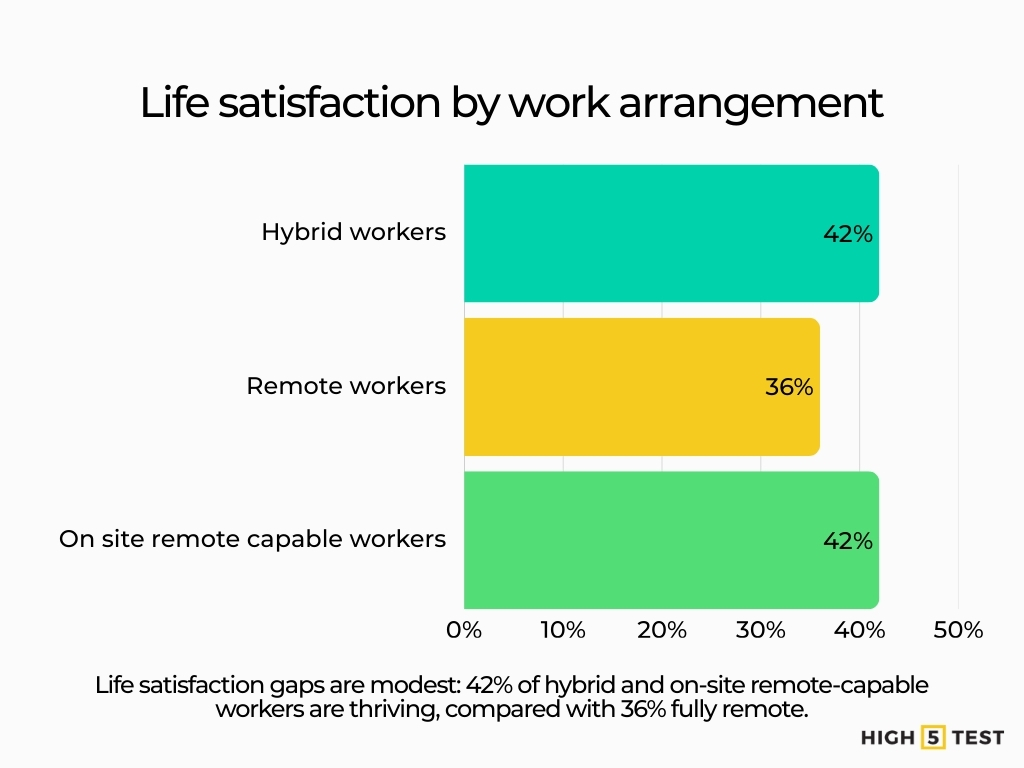
Life satisfaction shows smaller gaps. 42% of hybrid workers report thriving. Fully remote workers report 36%. On-site remote-capable workers also report 42%.
Source: Gallup
Statistics on office attendance and utilization
Hybrid schedules show up clearly in building attendance data.
Office utilization
In late January 2025, average weekly office occupancy across the top 10 US markets reached about 54.2%.
Source: Colliers
San Francisco trailed the national average at roughly 44.8% (vs. national ~54.2%) during the same period. These figures suggest partial recovery rather than a full return.
Source: Axios
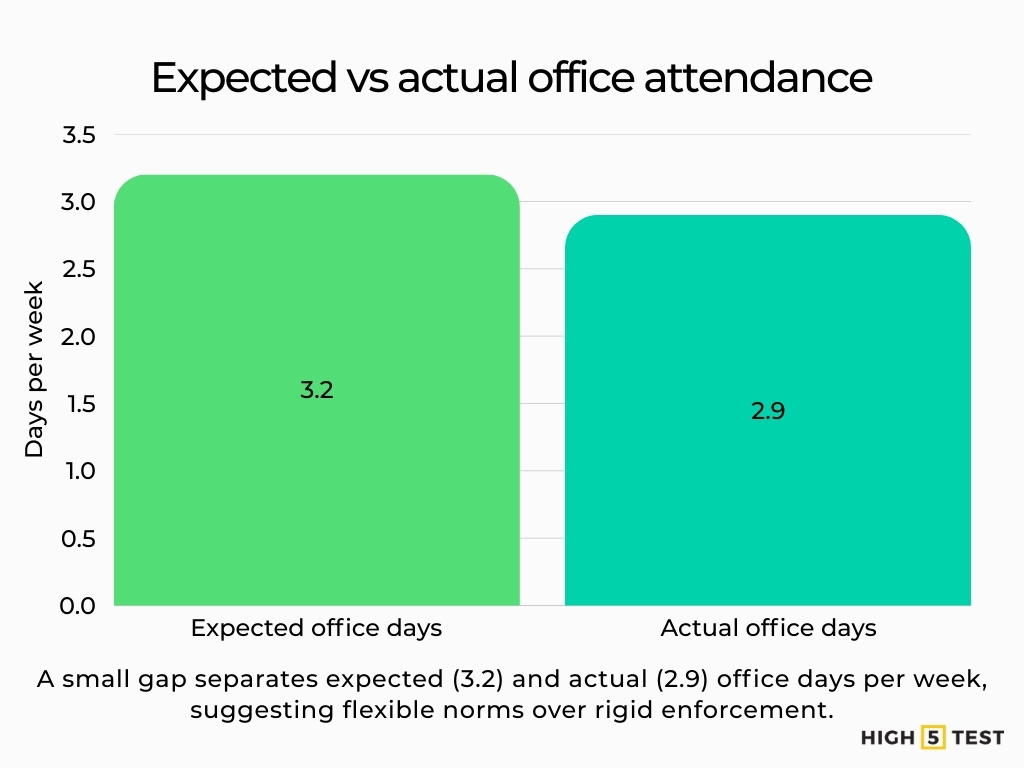
Expectation gap: How many days employers want vs. how many days employees attend
Employers expect an average of 3.2 office days per week. Actual attendance averages closer to 2.9 days per week. The gap shows compromise rather than conflict between policy and practice.
Source: CBRE
Stats on structured hybrid policies
Formal requirements have become more common. 85% of organizations now require at least three days per week in the office.
43% expect required office days to increase by 2030. This reflects long-term planning rather than immediate change.
Source: JLL
Statistics on technology and AI in hybrid work
Hybrid work depends on tools as much as location.
64% of workers say their companies are encouraging employees to use AI at work, up from 56% earlier in the year. AI tools now support meetings, documentation, and task coordination across mixed-location teams.
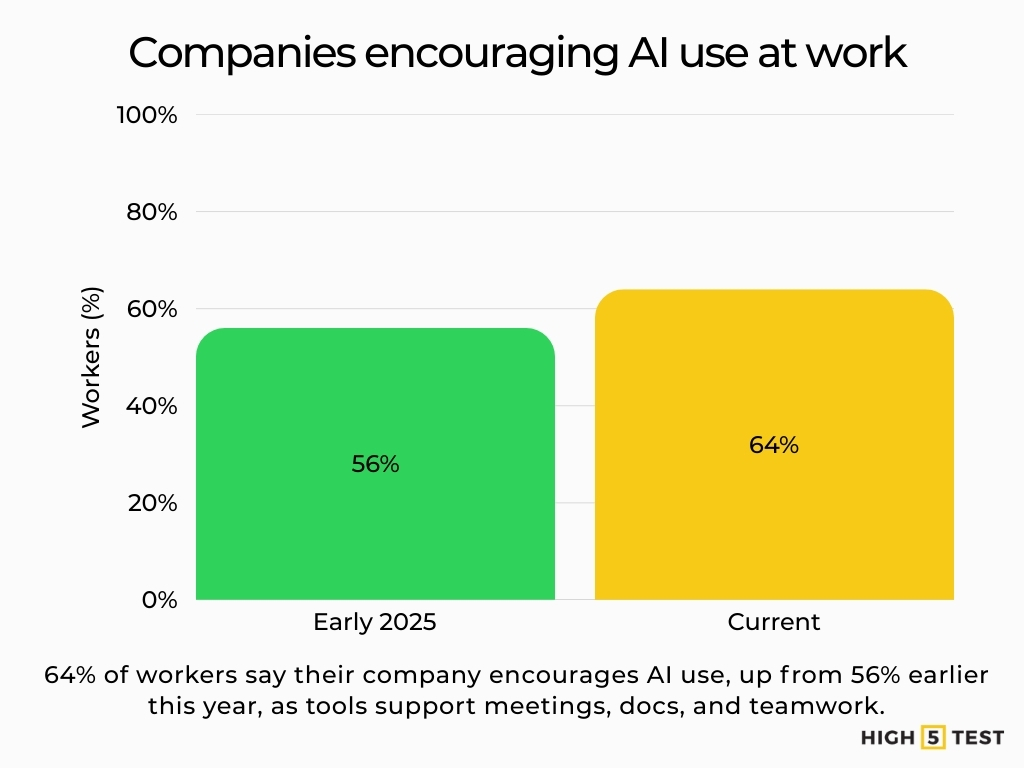
Source: Owl Labs
Demographics data: Working at home by gender
In 2024, the share of men working at home on workdays fell to 29% from 34% in 2023. Women remained steady at 36%. These differences reflect role distribution and flexibility rather than short-term shifts.
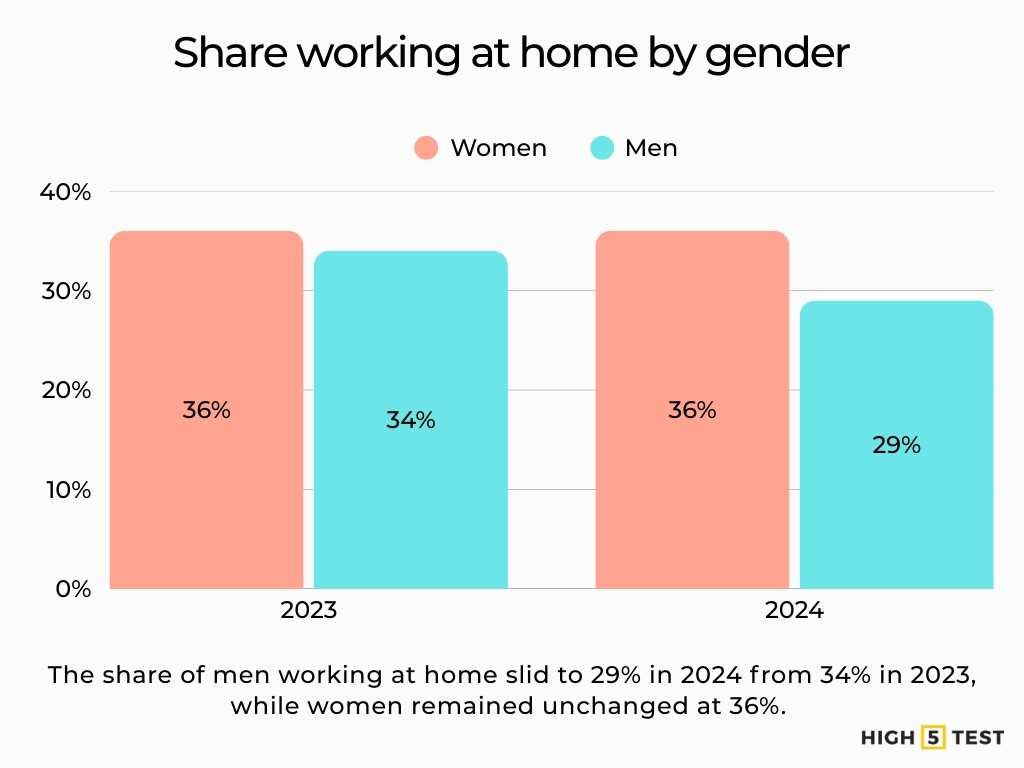
Source: U.S. Bureau of Labor Statistics – American Time Use Survey
Hybrid working statistics comparisons: US vs. global
International data helps place US trends in perspective.
In July 2024, US job postings showed 13.4% hybrid and 8.5% remote roles.
Source: LinkedIn Economic Graph
Global engagement levels show 31% engagement for remote workers and 23%for hybrid workers.
The US sits near the middle of global flexibility patterns rather than at the extremes.
Source: Gallup
Conclusion
Data from 2024 and 2025 confirms that hybrid work in the US has settled into a stable and repeatable model. Government surveys, employer data, and worker feedback all point to sustained participation. Hybrid schedules remain the preferred option for most remote-capable employees, even as office requirements become more structured.
Recent changes reflect refinement rather than retreat. Offices are busier but not full. Policies are clearer, yet flexibility remains. Technology, including AI, continues to shape how teams collaborate across locations. Long-term success will depend on how well organizations design hybrid systems that support performance, engagement, and steady operations over time.