Employee onboarding isn’t just a formality; it’s a high‑stakes investment. In the U.S., nearly 30% of new hires depart within their first 90 days, while companies typically spend $4,700 per hire on recruitment and onboarding . Yet organizations with structured onboarding programs see up to 82% higher new‑hire retention.
This report dives into 2024–2025 U.S. statistics, examining onboarding timing, technology, demographics, and remote formats, to show how optimized onboarding practices not only reduce turnover and cost, but also power inclusion, engagement, and early productivity.
What is employee onboarding?
Onboarding is the process of integrating new employees through orientation, immersion in culture, role clarity, and mentorship over time (up to 12 months) .
Source: SHRM.org
Often confused with orientation, onboarding includes formal and extended activities beyond Day 1 to drive retention and engagement.
10 most important employee onboarding statistics
- Only 12% of U.S. employees say their company did a “great” onboarding job in 2023; just 29% felt prepared and supported on their first day, indicating major gaps in first impressions. Source: SHRM
- Roughly 33% (1 in 3) of new hires leave within the first 90 days. Source: Enboarders
- 38% of employees quit within their first year, and 40% of those departures occur in the first 90 days. Source: Work Institute
- Strong onboarding programs improve new-hire retention by 82% and productivity by over 70%. Source: Brandon Hall Group.
- Structured, formal onboarding leads to 50% higher retention and 62% greater productivity. Source: SHRM
- Only 36% of U.S. employers say they have a structured onboarding process in place. Source: Exploding Topics
- Average cost to onboard per employee: $1,830 for SMBs; $3,000+ at the enterprise level. Source: AIHR.
50+ employee onboarding statistics and trends
General employee onboarding statistics in the US
Approximately 33% of new hires, that’s one in every three employees, end up leaving their job within the first 90 days of employment, highlighting the need for significant challenges in onboarding, role alignment, or company culture fit.
Source: Enboarders
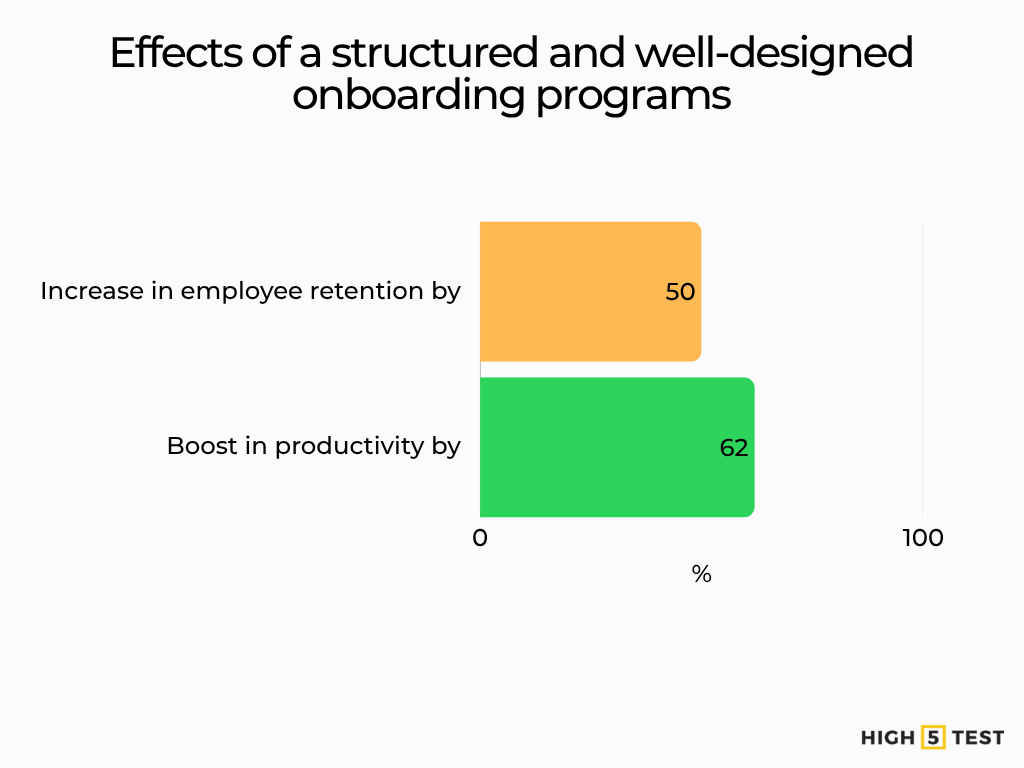
Implementing a structured and well-designed onboarding program has been shown to increase employee retention by up to 50% and boost productivity by 62%, underscoring the critical role onboarding plays in long-term workforce stability and performance.
Source: SHRM
Preboarding and early engagement
High-performing organizations are 35% more likely to initiate the onboarding process before a new hire’s official start date, demonstrating a proactive approach to employee engagement and early integration.
Source: Aberdeen
An effective preboarding program can increase employee retention by as much as 82% while significantly reducing the likelihood of first-day no-shows, emphasizing the importance of early engagement before the official start date.
Source: AIHR
AI, automation, and tools
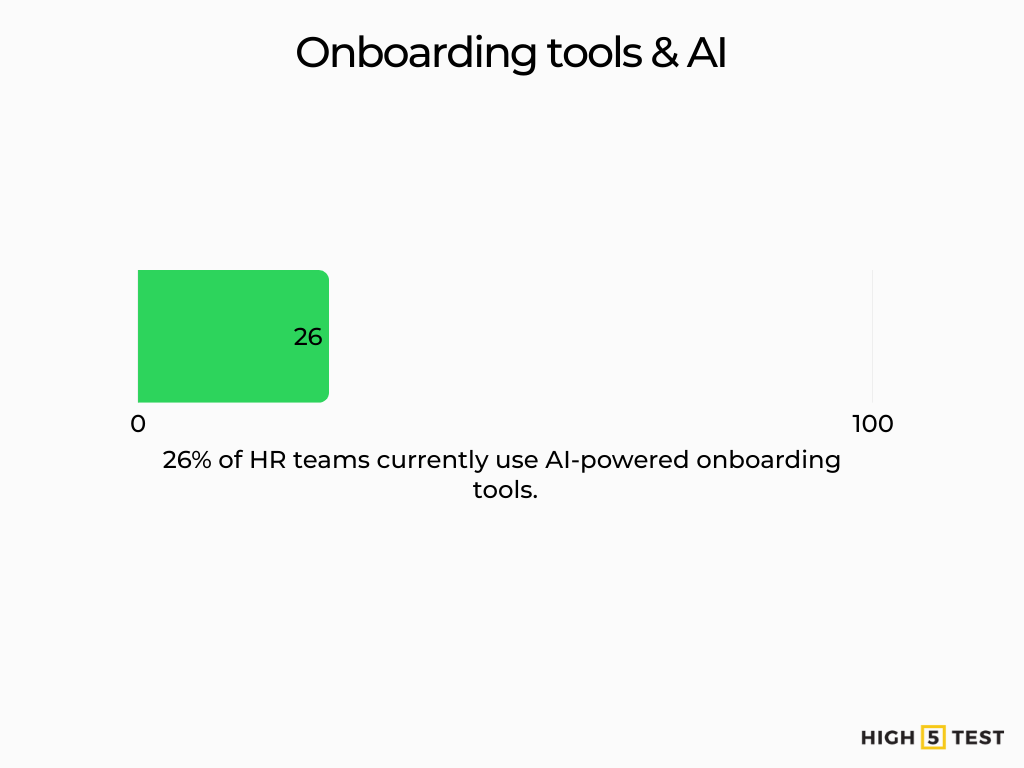
As of the latest data, 26% of HR departments are now utilizing artificial intelligence to support their onboarding processes, an increase from just 15% in 2022, reflecting a growing trend toward automation and efficiency in talent management.
Source: Eightfold
A substantial 97% of employees report that leveraging tools and software to streamline the onboarding process is important, with 81% going further to describe it as ‘crucial,’ underscoring the demand for efficient, technology-driven onboarding experiences.
| Employees | Importance of the onboarding process |
|---|---|
| 81% | crucial |
| 97% | important |
Source: BambooHR
Employee onboarding demographics stats
Gender & ethnicity representation
Among remote-capable U.S. workers: 49.6% male, 46.4% female, 64.8% white, 13.3% Hispanic/Latino, 9.6% Black, 7.6% Asian. Although not tied to onboarding specifically, workforce-wide stats highlight the importance of inclusive onboarding, particularly for historically underrepresented groups.
Source: US Career Institute
Gender gaps in leadership
Only 32.2% of senior leadership positions were held by women in 2023, despite representing 60% of the workforce. This context reinforces why early-stage onboarding experiences must address systemic gaps. Feel free to take the leadership assessment to discover your leadership strengths and style.
Source: World Economic Forum
Structured vs. unstructured onboarding statistics
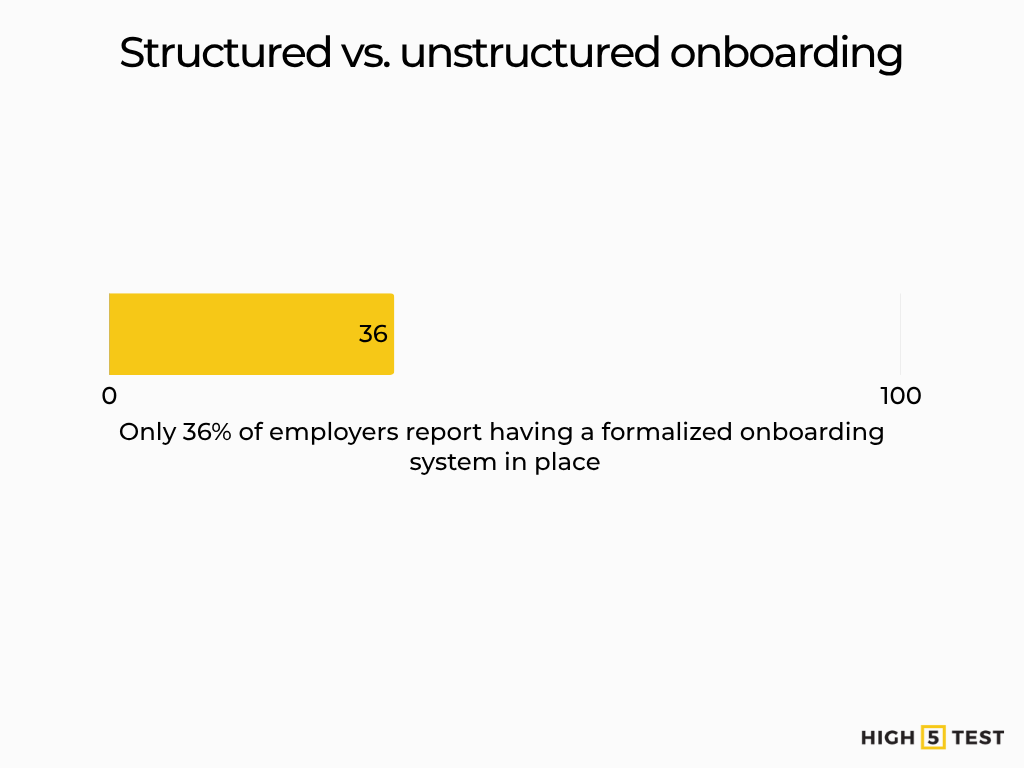
Despite the proven benefits of structured onboarding, only 36% of employers report having a formalized system in place, indicating a significant gap in the adoption of consistent and effective onboarding practices.
Source: Exploding Topics
Only 15% of organizations sustain the onboarding process beyond six months, although up to 90% of retention decisions occur in that timeframe.
Source: SHRM.
Stats on remote and hybrid onboarding
Currently, 75% of employees in remote-capable roles work remotely at least part of the time, reflecting a lasting shift in workplace flexibility and hybrid work models following the widespread adoption of remote work practices.
Source: Pew Research Center
Employee preferences regarding work arrangements continue to evolve, with 32% favoring fully remote work, 41% preferring a hybrid model, and only 27% expressing a desire to work entirely on-site, highlighting a clear shift toward flexible work environments.
| Employees | Work preference |
|---|---|
| 32% | Fully remote |
| 42% | Hybrid |
| 27% | On-site |
Source: Quantum Workplace
Hybrid employees are nearly 4x more likely to feel pressured by employers to return to the office compared to fully remote workers.
Source: Owl Labs
Stats on the cost of onboarding
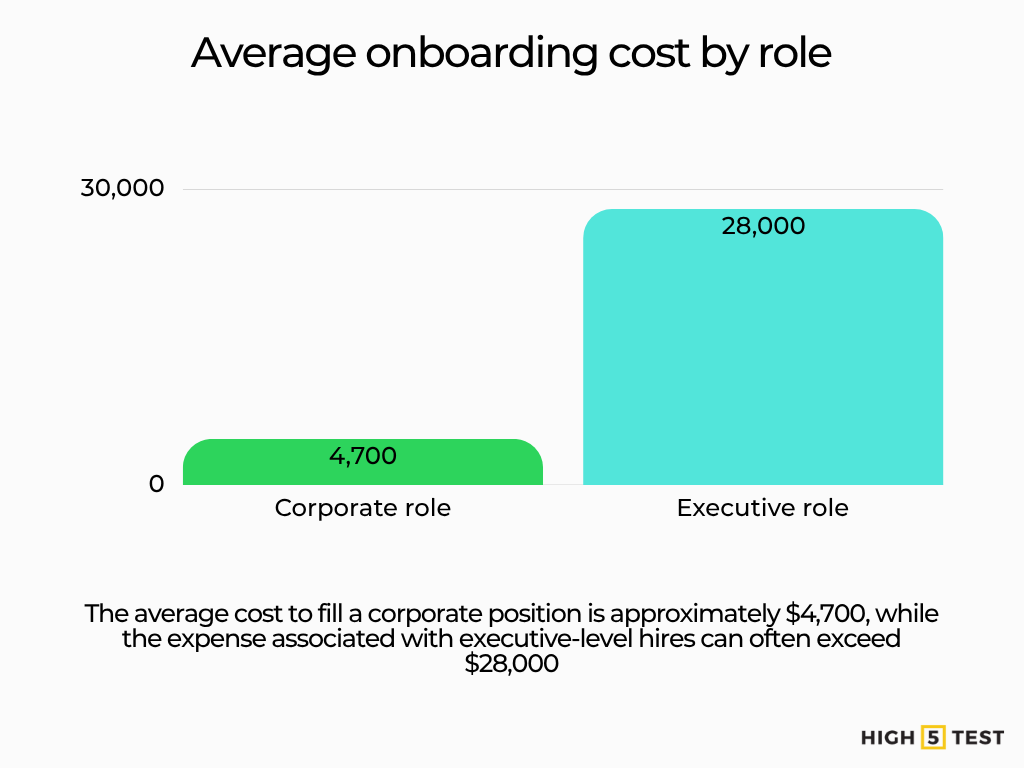
The average cost to fill a corporate position is approximately $4,700, while the expense associated with executive-level hires can often exceed $28,000, which illustrates the significant financial investment involved in talent acquisition, particularly for senior roles.
Source: Workwolf
For small and mid-sized businesses (SMBs), the average onboarding cost is approximately $1,830 per employee, whereas larger enterprises typically invest over $3,000 per new hire, reflecting the varying resource demands and scalability challenges across different organizational sizes.
Source: Leena.ai
Onboarding’s impact on retention & engagement
Approximately 42% of voluntary turnover is assessed as preventable with better onboarding or manager support.
Source: Gallup
Only 12% of employees feel onboarding was well-executed, but these individuals are nearly 3× more likely to say they hold the “best possible job” for them.
Source: SHRM
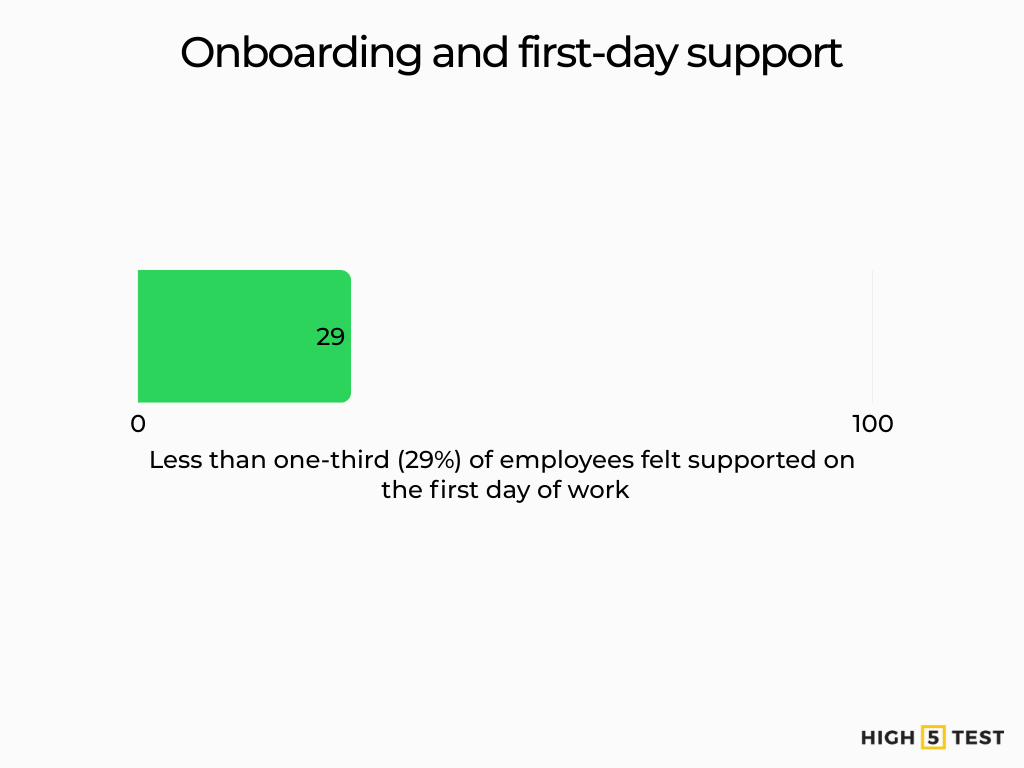
Less than one‑third (29%) felt supported on the first day of work, pointing to a critical opportunity for improvement.
Source: SHRM.
New-hire feedback insights
44% of hires regret starting the job within their first week, and the period of the first 44 days is the critical window to influence retention.
Source: BambooHR
Only 15% of employers continue onboarding beyond six months, despite 90% of retention decisions occurring in that stretch.
Source: SHRM
70% of new hires know if a job is a good fit within the first month, and 29% decide in the first week, especially staring into employer action within 44 days .
| Employees | Period for conclusions |
|---|---|
| 70% | first month |
| 29% | first week |
Onboarding tools & platforms adoption
97% of surveyed employees expect digital tools in their onboarding; 81% consider it “crucial” .
Source: BambooHR
26% of HR teams currently use AI-powered onboarding tools.
Source: SHRM
The global onboarding software market is projected to grow from $1.77 billion in 2024 to $2.12 billion in 2025, with fast-rising demand for AI/automation (20% CAGR).
Source: Business Research Company
Consequences of poor onboarding
Poor onboarding can cost 90–200% of an employee’s annual salary in estimated turnover losses.
Source: BambooHR
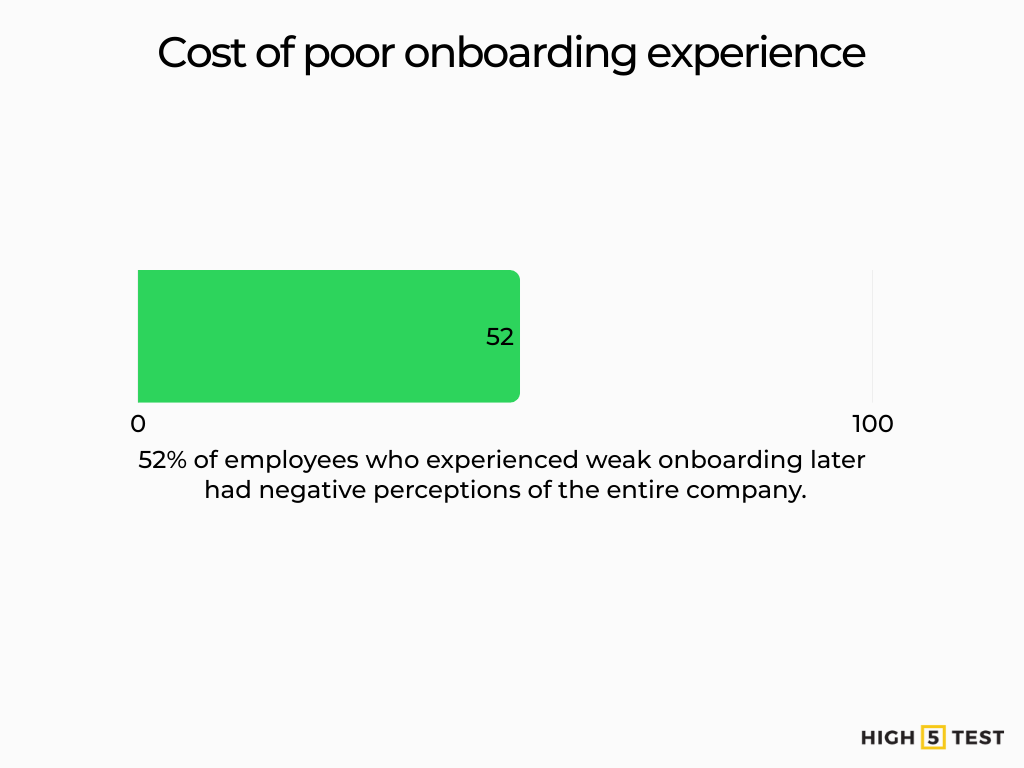
52% of employees who experienced weak onboarding later had negative perceptions of the entire company.
Source: BambooHR
FAQ
What are the statistics of effective onboarding?
Research shows that companies with effective onboarding processes improve new hire retention by 82% and productivity by over 70%. Additionally, organizations that invest in structured onboarding see 60% higher year-one employee engagement compared to those with no formal process. These statistics highlight the direct link between onboarding and long-term workforce performance.
Are 7 in 10 employees more likely to stay 3+ years after a positive onboarding experience?
Yes. Studies confirm that 69% of employees are more likely to stay with a company for three years or more if they experience a positive, engaging onboarding process. This reinforces the importance of designing onboarding programs that make employees feel welcomed, supported, and aligned with the company’s culture.
Conclusion
Getting onboarding right is a measurable competitive advantage. Ignoring onboarding can mean losing one in three hires in just three months, plus incurring turnover costs of up to 200% of an employee’s annual salary.
In contrast, investing in structured onboarding drives 82% higher retention and speeds new-hire productivity by 70% or more. With average per‑hire costs of $4,700, these gains can rapidly offset the investment.
Organizations should audit onboarding length, leverage inclusive tools, implement demographic-responsive touchpoints, and provide manager‑led support. That way, they can convert onboarding from a cost center into a long‑term driver of employee loyalty, diversity, and business performance.
