Job hopping remains a steady feature of the US labor market in 2024 and 2025. The pace looks calmer than the peak years that followed the Great Resignation. Recent Bureau of Labor Statistics data support that shift. The quit rate averaged 2.1% in 2024 and sat near 2.0% in late 2025, which signals a more settled level of employee movement.
This report breaks down the most reliable indicators tied to job hopping. It focuses on the JOLTS quits rate as the clearest measure of voluntary exits. It also uses BLS tenure data to show how long workers stay with an employer. Industry quits rates add detail on where turnover stays highest. Wage growth data for job switchers and stayers helps explain how the payoff from switching changed over the period.
You can use these numbers to set expectations. Employers can benchmark retention risk and plan hiring volume. Workers can gauge timing, pay potential, and competition for openings.
10 most interesting job hopping statistics
- US quits rate remained steady near ~2% through 2024–2025, indicating a more normalized but persistent level of employee mobility after the Great Resignation.
- The annual quits rate was 2.1% in 2024, confirming that voluntary exits are still a meaningful force in the labor market.
- In December 2025, the quits rate was 2.0%, and there were approximately 3.2 million quits – an important short-term snapshot of job-hopping behavior.
- Median tenure for all workers was 3.9 years, demonstrating that people are changing jobs faster than in decades past.
- Early-career workers show much higher mobility:
- Ages 20–24, median tenure ~1.5 years.
- Ages 25–34, median tenure ~2.8 years.
- Job switchers’ wage growth in Dec 2025 was 4.1% while stayers’ was 4.0%, illustrating that the traditional pay advantage from switching jobs has narrowed.
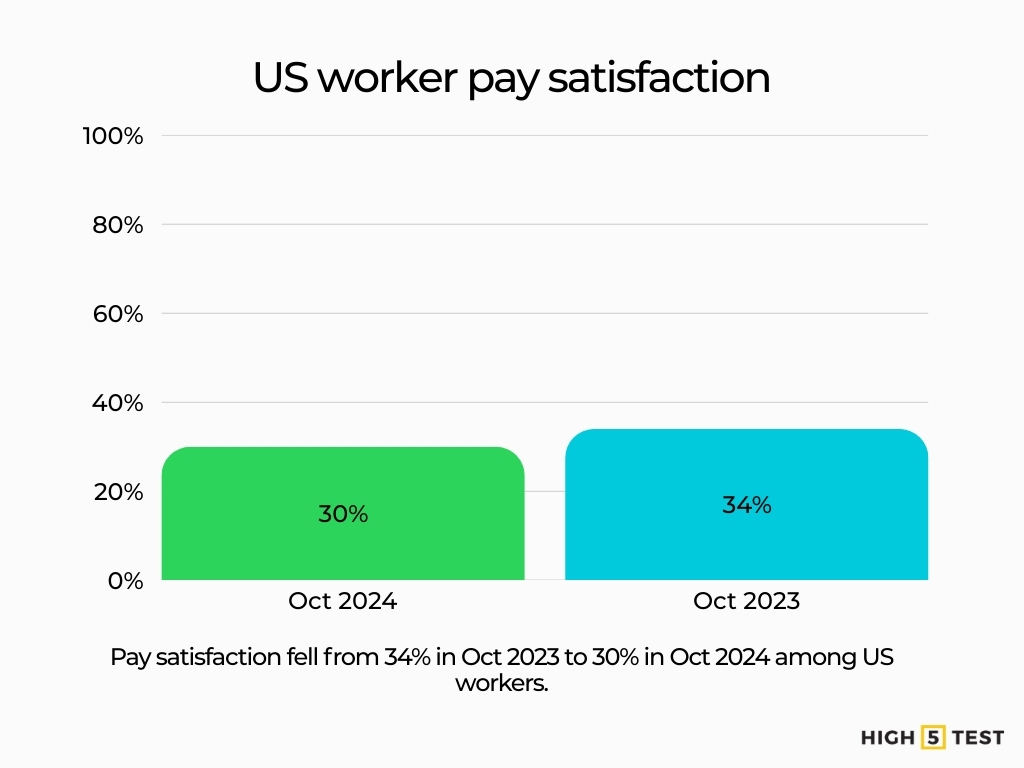
- Only ~30% of US workers were “extremely or very satisfied” with their pay in late 2024, contributing to ongoing movement between jobs.
- Turnover cost averages about 33.3% of a departing employee’s base salary, meaning job hopping has a substantial financial impact on employers.
- Turnover costs for many exits fall in a 19%–40% range of base pay, emphasizing the business risk of high churn.
- Quitting rates vary sharply by industry:
- In Dec 2025, Accommodation & Food Services had a 4.2% quits rate, and
- Leisure & Hospitality sat at 3.8%, while lower churn industries like Government remained below 1%.
What changed from 2024 to 2025?
Job hopping did not disappear – it normalized. Quits stayed around ~2% through late 2025, well below 2021–2022 highs, and consistent with a “cooler” labor market.
What is job hopping?
Job hopping usually means changing employers within a short period. Many people use 1 to 2 years as a rough benchmark. No single public dataset counts job hoppers directly. Analysts use a set of indicators that show job switching behavior at scale.
Job hopping statistics in the U.S. (2024-2025)
The JOLTS quits rate measures voluntary separations as a percent of employment – a powerful indicator of worker confidence and mobility.
- The annual quits rate was 2.1% in 2024. The quits rate was 2.0% in December 2025.
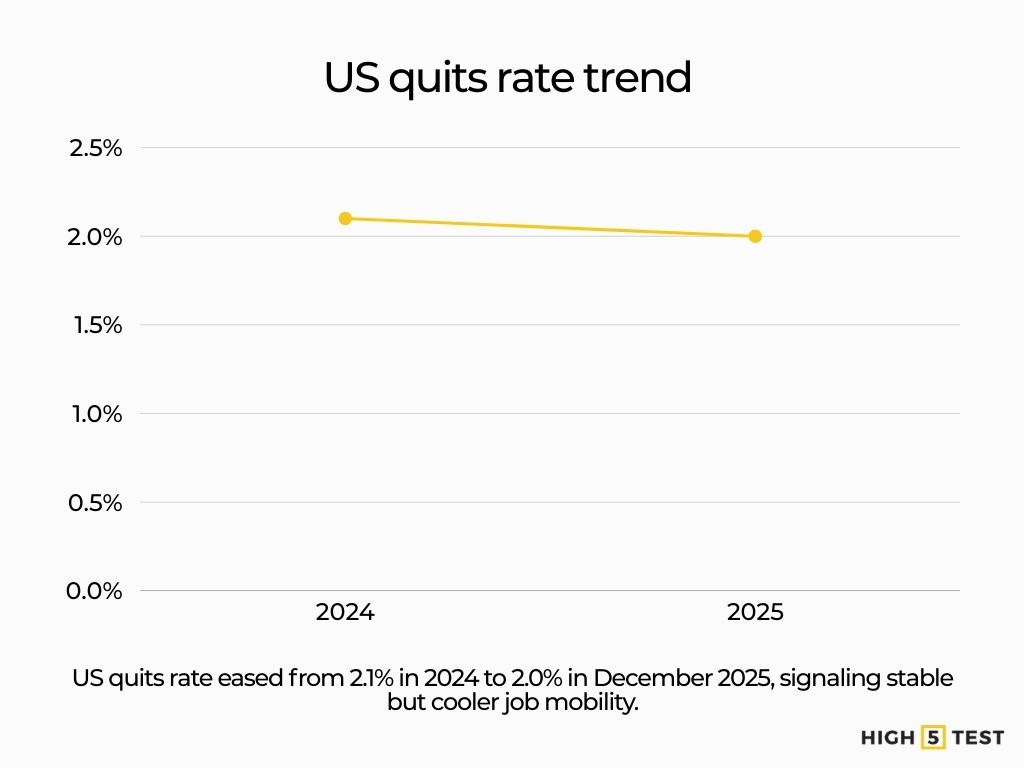
When quits are high, workers have more leverage and switch more freely. When quits cool, job hopping tends to slow or become more selective. The shift is modest, but it lines up with a slower pace of voluntary exits. It also points to a more selective approach to switching jobs.
Source: U.S. Bureau of Labor Statistics
Job switching statistics by industry: where churn stays high
Month-to-month numbers can swing. The highest churn sectors still tend to sit at the top of the list.
Highest-churn industries
| Industry | Dec 2024 | Dec 2025 |
| Accommodation and Food Services | 3.1% | 4.2% |
| Leisure and Hospitality | 2.9% | 3.8% |
| Retail trade | 2.2% | 2.9% |
| Transportation, warehousing, and utilities | 2.2% | 2.5% |
| Mining and logging | 1.1% | 2.2% |
| Health Care and Social Assistance | 1.7% | 1.7% |
Source: U.S. Bureau of Labor Statistics
Lower-churn industries
| Industry | Dec 2024 | Dec 2025 |
| Government (Overall) | 0.7% | 0.6% |
| Private educational services | 1.2% | 0.7% |
| Finance and insurance | 0.9% | 0.8% |
| Manufacturing | 1.0% | 1.0% |
| Real estate, rental, and leasing | 1.1% | 1.2% |
| Wholesale trade | 1.0% | 1.2% |
Source: U.S. Bureau of Labor Statistics
Statistics on job hopping and age: tenure shows who moves most
Tenure data makes one point very clear. Job hopping is concentrated earlier in a career.
| Age | Men | Women |
| All workers (16 years and over) | 3.9 | |
| Ages 20-24 | 1.5 | 1.3 |
| Ages 25–34 | 2.8 | 2.5 |
| Ages 35–44 | 4.9 | 4.3 |
| Ages 45–54 | 7.5 | 6.3 |
| Ages 55–64 | 10.0 | 8.5 |
Source: U.S. Bureau of Labor Statistics
Job hopping is structurally higher early-career and falls with age—this is consistent across years and is visible in tenure data long before the pandemic. A short early career median does not mean constant churn for every worker. It does mean that many early-career workers change jobs often enough to pull the median down.
Is switching jobs still the fastest path to higher pay?
In early 2024, job switcher wage growth was higher than job stayer wage growth. In late 2025, the two measures were much closer. In December 2025, they were 4.1% for switchers and 4.0% for stayers.
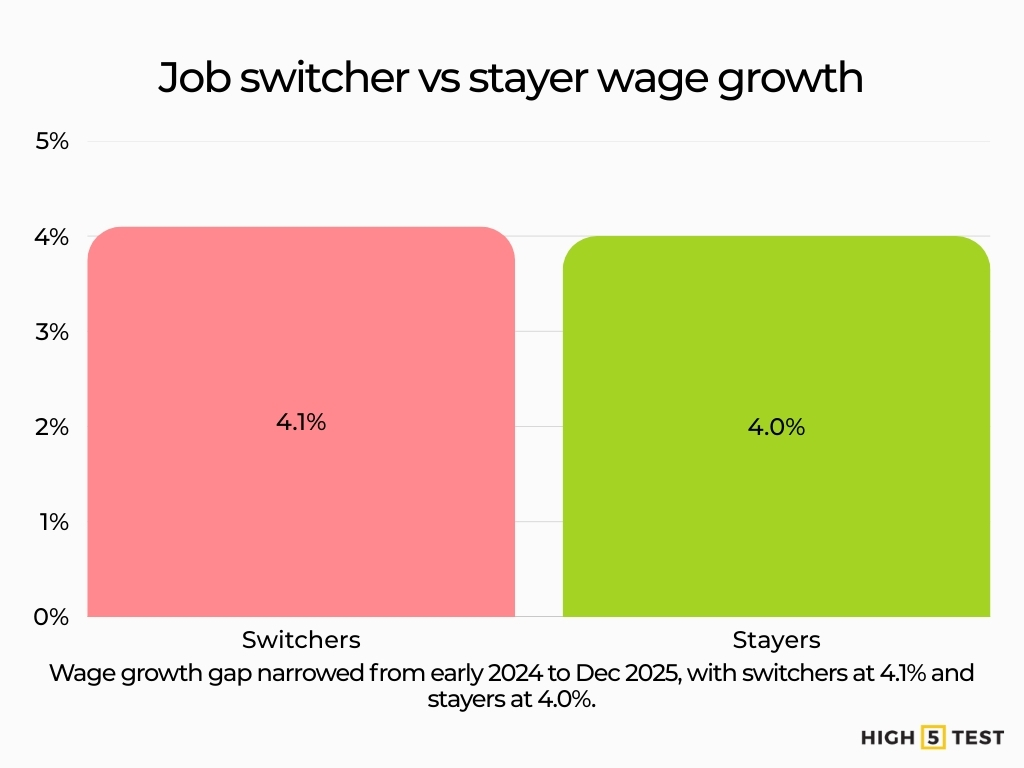
Switching jobs can still lift pay, especially with a bigger scope or stronger in-demand skills. The data shows a smaller wage gap, so frequent switching alone is less likely to deliver a large raise.
Source: Federal Reserve Bank of St. Louis, Federal Reserve Bank of St. Louis
Why are people job-hopping?
Pay and benefits still drive movement. Only 30% of US workers were extremely or very satisfied with their pay in Oct 2024. Pay satisfaction was down from 34% the prior year. Low pay satisfaction creates pressure to look elsewhere, even when job security feels solid.
Source: Pew Research Center
Career growth is a top reason people leave. “Career issues” is highlighted as a leading driver in its top reasons for leaving. Workers often leave when promotions feel slow, responsibilities plateau, or learning stalls.
Source: Work Institute
Work-life balance and flexibility matter. The same report lists work-life balance among the key reasons people exit. Scheduling and flexibility can outweigh pay for many roles, especially in high churn sectors.
Source: Work Institute
Job fit can trigger a switch. Alignment between a person’s abilities and interests and the work they actually do is important. A mismatch can show up as burnout, low engagement, or a desire to pivot into a different function.
Source: Work Institute
Managers and workplace culture influence quits. “Having managers they want to work for,” and management and culture become more important as careers progress. Many people do not leave their occupation. They leave a manager, team dynamics, or an unhealthy work environment.
Source: Work Institute
Outside options shape the decision. Quits rate can act as a measure of workers’ willingness or ability to leave jobs. When workers believe they can land a comparable or better job, quitting feels less risky.
Source: U.S. Bureau of Labor Statistics
What does job hopping cost employers
Job hopping creates a repeat cycle of backfilling, training, and ramp time. Those costs show up in budgets. They also show up in performance and service quality.
- Turnover is at about 33.3% of a departing employee’s base salary.
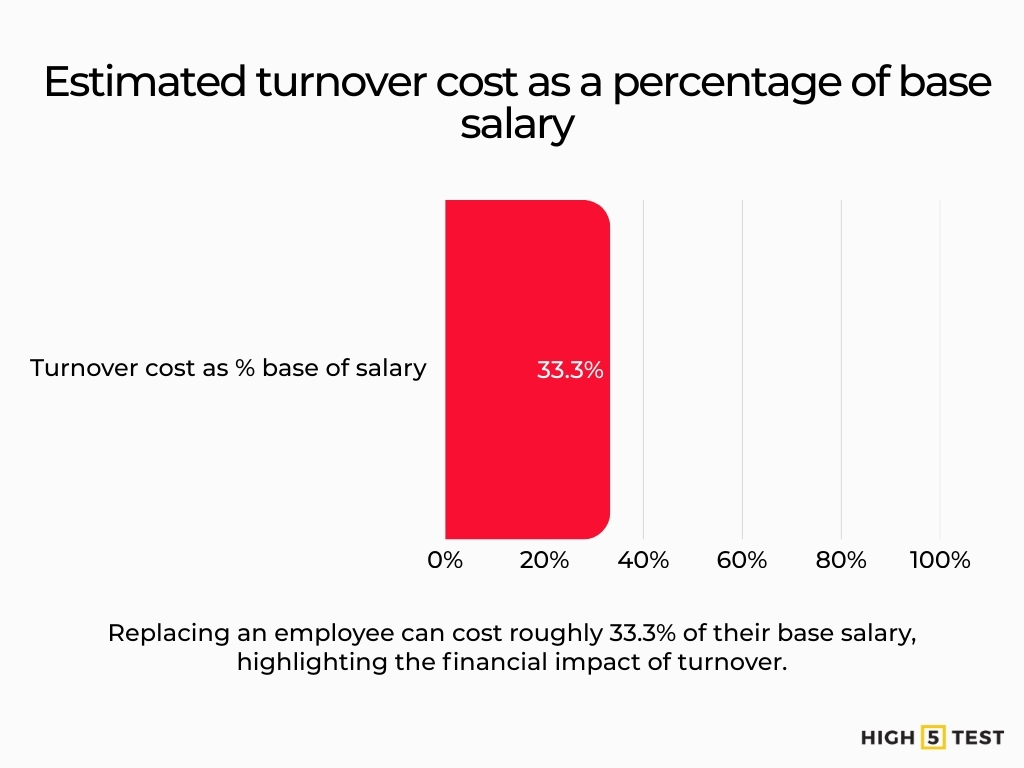
- Most jobs fall in a 19% to 40% base pay cost range.
- US employers spend close to $900,000,000,000 replacing employees who quit in 2023.
Source: Work Institute
Why retention needs data, not guesswork
Quit rates vary sharply by industry. Turnover pressure is not evenly distributed. Retention plans should match the churn profile of each business unit, not a single company-wide target.
It is recommended to track turnover by tenure milestones like the first 90 days, 6 months, and 1 year. Early exits often point to hiring fit, onboarding, scheduling, or manager issues. Later exits tend to connect to growth paths, pay progression, or workload. Splitting turnover this way helps you pick the right fix.
Another one is to combine turnover counts with turnover costs. Headcount loss alone does not show business impact. Cost-weighted turnover highlights which roles are most expensive to lose and where retention investment can pay off fastest.
Source: Work Institute
Conclusion
Quits stayed near 2% from 2024 through late 2025. That points to steady mobility after the post-pandemic spike. Tenure data adds context. The January 2024 median was 3.9 years. It fell to 1.4 years for ages 20 to 24. Pay trends also shifted. Switcher wage growth stayed slightly above stayer wage growth in December 2025, but the gap was small.
Employers can use these measures to set retention plans. High churn sectors should plan for steady turnover. Lower churn sectors can focus on internal mobility and clear pay paths. Workers can use the same data to time a move. Aim for a job that improves pay. Look for a bigger scope or better stability.
FAQ
What is the job-hopping rate in the US in 2024?
A strong official proxy is the JOLTS annual quits rate for total nonfarm. It was 2.1% in 2024.
What was the quit rate in 2025?
In December 2025, quits were 3.204 million, and the quits rate was 2.0%.
How long do people stay with an employer in the US?
In 2024, annual quit rates were highest in accommodation and food services at 4.1% and in leisure and hospitality at 3.9%.
Which industries have the most job hopping?
In 2025, quits were highest in Accommodation and Food Services (4.2%) and Leisure and Hospitality (3.8%) (seasonally adjusted).