The US startup landscape in 2024–2025 is full of contradictions. More people are starting businesses than ever before, yet survival remains brutally hard. Venture funding is rebounding, but it’s flowing to fewer companies and often on tougher terms. At the same time, AI is accelerating growth for a small group of startups while raising the bar for everyone else. This data-driven report cuts through the noise to show what’s actually happening in US startups today, using the latest statistics to help founders, operators, and investors make smarter decisions in a rapidly changing environment.
This report brings together the latest numbers on:
- How many startups and small businesses does the US have
- Survival and failure rates, plus the most common causes of failure
- Funding volumes and timelines, with a close look at AI
- Who the founders are today, including gender and diversity
- How rare unicorn outcomes are, and when that target makes sense
You will leave with a practical view of the opportunities and the risks, backed by current data.
10 most interesting startup statistics in the US (2024/2025)
- Nearly 1 in 5 US adults (19%) is involved in early-stage entrepreneurship, the highest level ever recorded in the country, meaning entrepreneurship is no longer a niche activity, but a mainstream career path.
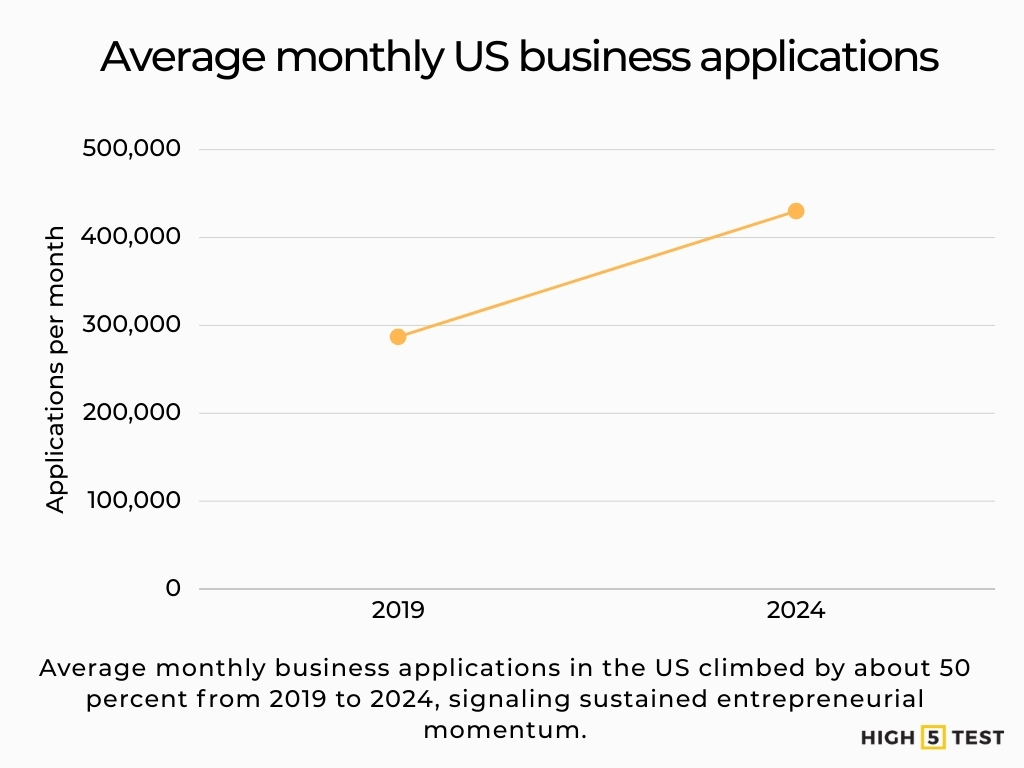
- Americans file about 430,000 new business applications every month, which is roughly 50% higher than pre-pandemic levels, signaling a permanent shift, not a temporary spike, in startup creation.
- Only about 35% of new businesses survive for 10 years, meaning the majority of startups don’t fail fast—they fade out over time due to capital constraints, weak demand, or stalled growth.
- 42% of startup failures happen because there is no real market need, making product-market fit a larger risk than competition, technology, or execution mistakes combined.
- Venture capital funding rebounded to roughly $209 billion in 2024, up nearly 30% year over year, but most of that growth came from a small number of massive AI deals.
- AI startups captured nearly one-third of all venture capital in 2024, and a handful of companies alone raised $40+ billion, highlighting how concentrated today’s funding market has become.
- The median time between funding rounds has stretched to 700+ days, up from around 450 days just a few years ago—forcing founders to plan for much longer runways than in the 2021 boom.
- Women now start nearly 50% of new US businesses, yet startups founded solely by women still receive only about 1–2% of total venture capital, exposing one of the largest inefficiencies in the funding market.
- The average successful founder is about 42 years old, and founders in their 40s are statistically more likely to build high-growth companies than founders in their 20s—experience matters more than hype.
- The probability of building a $1B “unicorn” is roughly 0.00006% (about 3 in 5 million companies), meaning founders who optimize only for unicorn outcomes are betting on one of the rarest results in business.
40+ startup statistics in the US (2024/2025)
Startup creation remains elevated compared with the pre-2020 baseline, and the pipeline is still strong.
New business applications and small-business counts
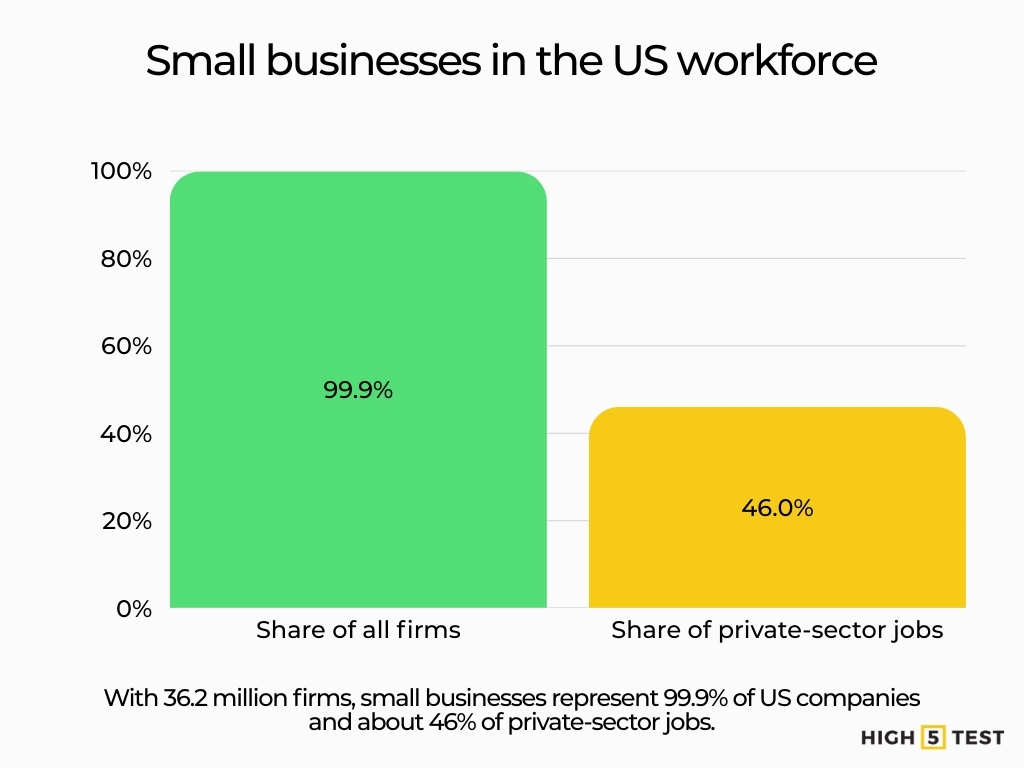
The US had 36.2 million small businesses in the latest 2025 data. Small businesses represent 99.9% of all firms and about 46% of private sector employment.
Source: Small Business Administration – Office of Advocacy
Small businesses also drove a net increase of 1.2 million jobs, which equals 88.9% of the net total in that dataset.
Source: Small Business Administration – Office of Advocacy
In July 2024, the US had about 34.8 million small businesses employing ~59 million people (45.9% of private-sector workers), reflecting continued growth since 2020.
Source: Small Business Administration – FAQs
New business intent also stayed high. In 2024, the US averaged about 430,000 business applications per month, up from roughly 287,000 per month in 2019, which is about a 50% increase.
Source: Reuters
There were 5.2 million new business applications filed in 2024 (above the 3.5 million record in 2019), sustaining the pandemic-era surge in entrepreneurship.
Source: U.S. Chamber of Commerce
Entrepreneurial activity among adults
The Total Entrepreneurial Activity (TEA) reached 19% of the adult population (ages 18–64) in 2024, matching the previous US record and representing the highest TEA level.
Source: Global Entrepreneurship Monitor
The United States’ 19% TEA is almost two-thirds higher than the average TEA across 32 high-income economies, highlighting how unusually entrepreneurial the US environment remains.
Source: Global Entrepreneurship Monitor
Statistics on startup survival and failure rates
The odds improve with time, but the early years remain the steepest test.
Survival over 1, 5, and 10 years
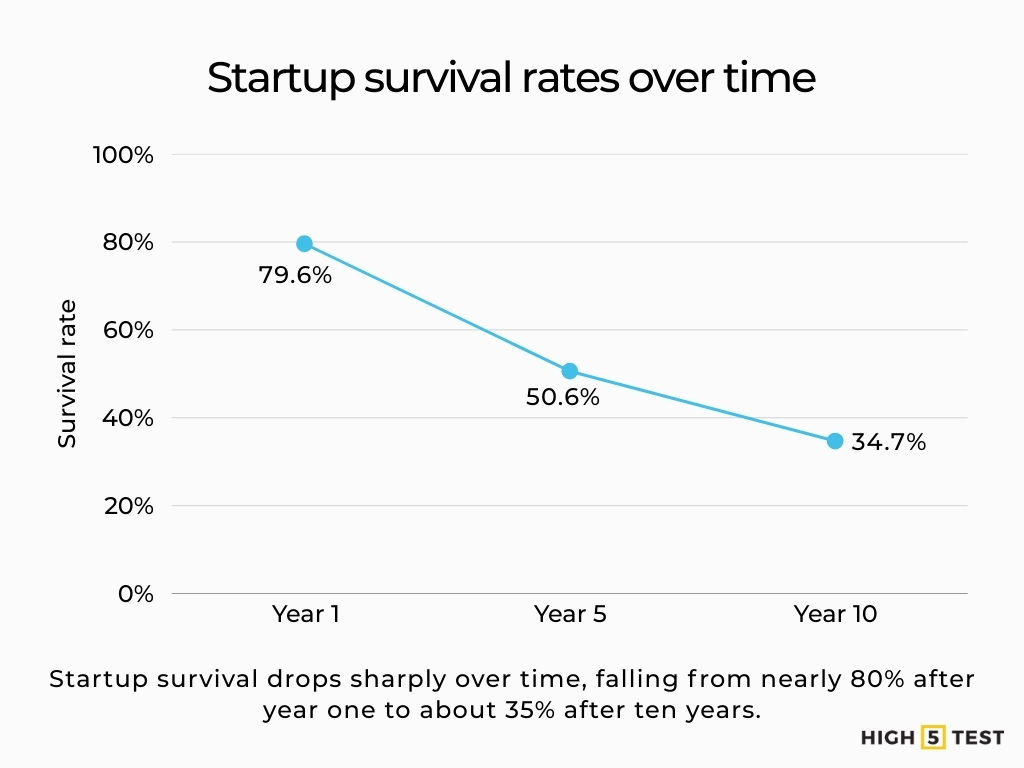
For US private sector establishments born in March 2013, 79.6% survived the first year. 50.6% were still operating after five years. 34.7% were still active ten years later, as of March 2023.
Source: Bureau of Labor Statistics
Put differently, for that cohort, about 20.4 percentage points of establishments closed in the very first year, and the survival rate declined by roughly 45 percentage points over the 10-year period (100% → 34.7%), with the steepest drop in the first year of operation.
Source: Bureau of Labor Statistics
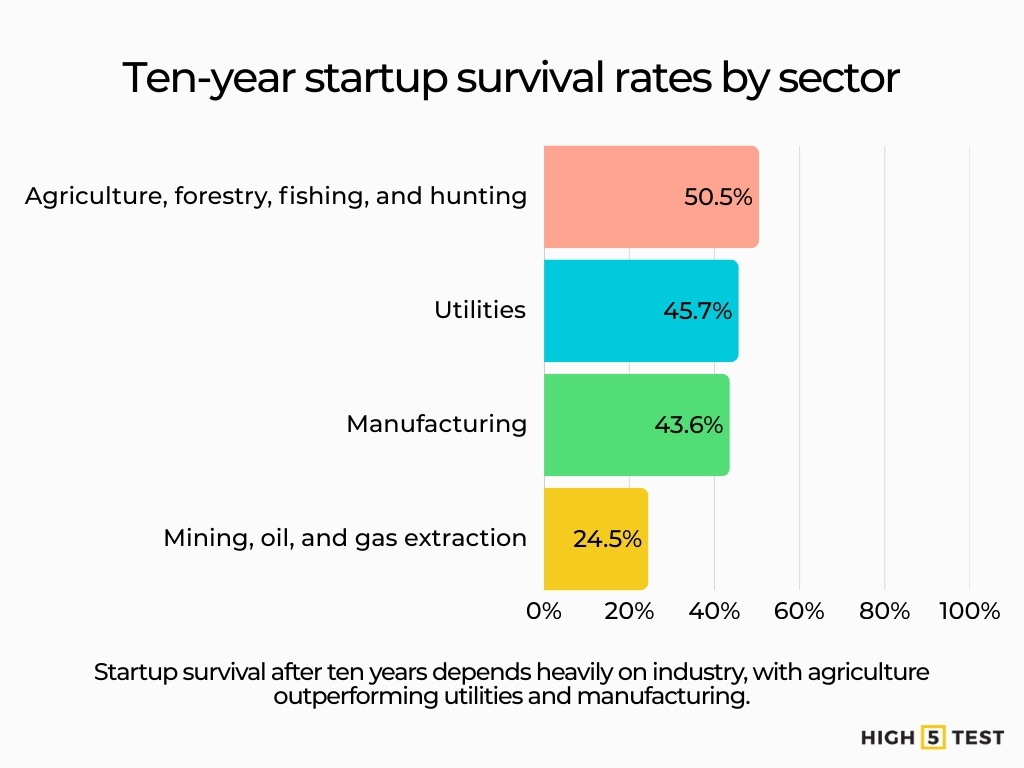
Sector differences are pronounced: Agriculture, forestry, fishing, and hunting had a 10-year survival rate of ~50.5%, utilities 45.7%, and manufacturing 43.6%, while mining and oil and gas extraction had the lowest at 24.5% for the 2013 cohort.
Source: Bureau of Labor Statistics
Failure rates and why startups fail
One dataset estimates 21.5% of businesses fail in year one, 48.4% by year five, and 65.1% by year ten.
Source: Lending Tree
A separate analysis of failed startups highlights the most common drivers. It attributes 34% of failures to a lack of product-market fit. It cites 22% to marketing problems, 18% to team issues, and 16% to finance problems.
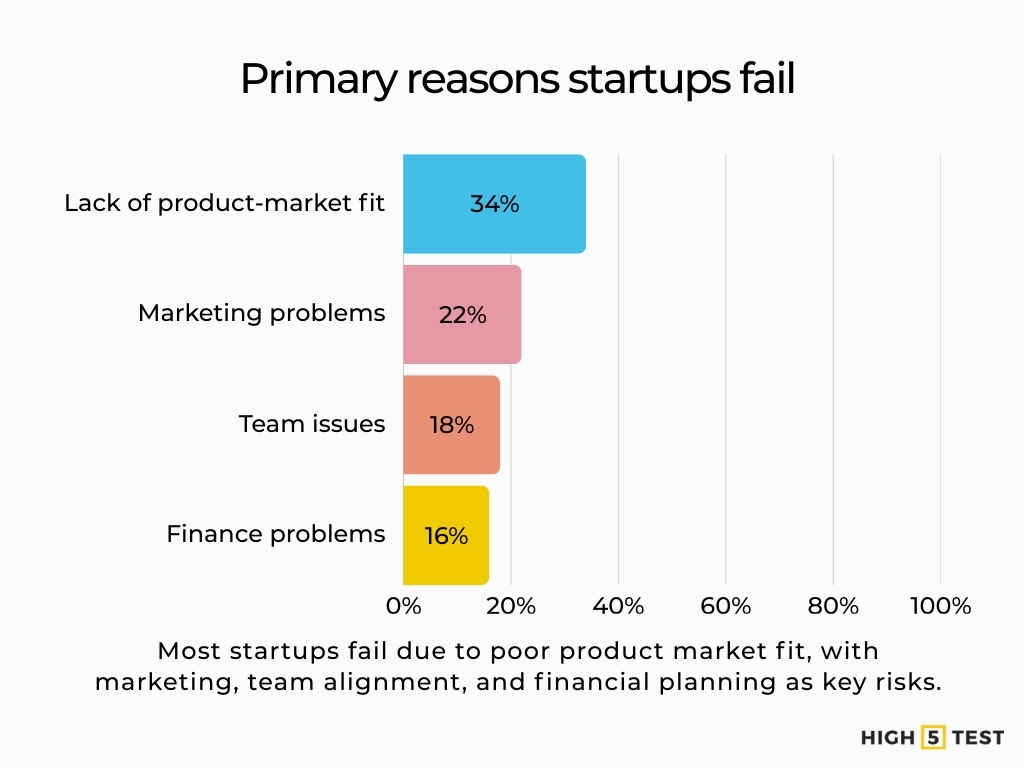
Source: Failory
Statistics on startup funding, venture capital, and valuations
Capital returned in size, but access is uneven, and timelines are longer.
Overall VC volumes and the AI effect
US venture capital investment reached about $209 billion in 2024. That is up from about $162.2 billion in 2023, a rebound after the 2022 to 2023 slowdown.
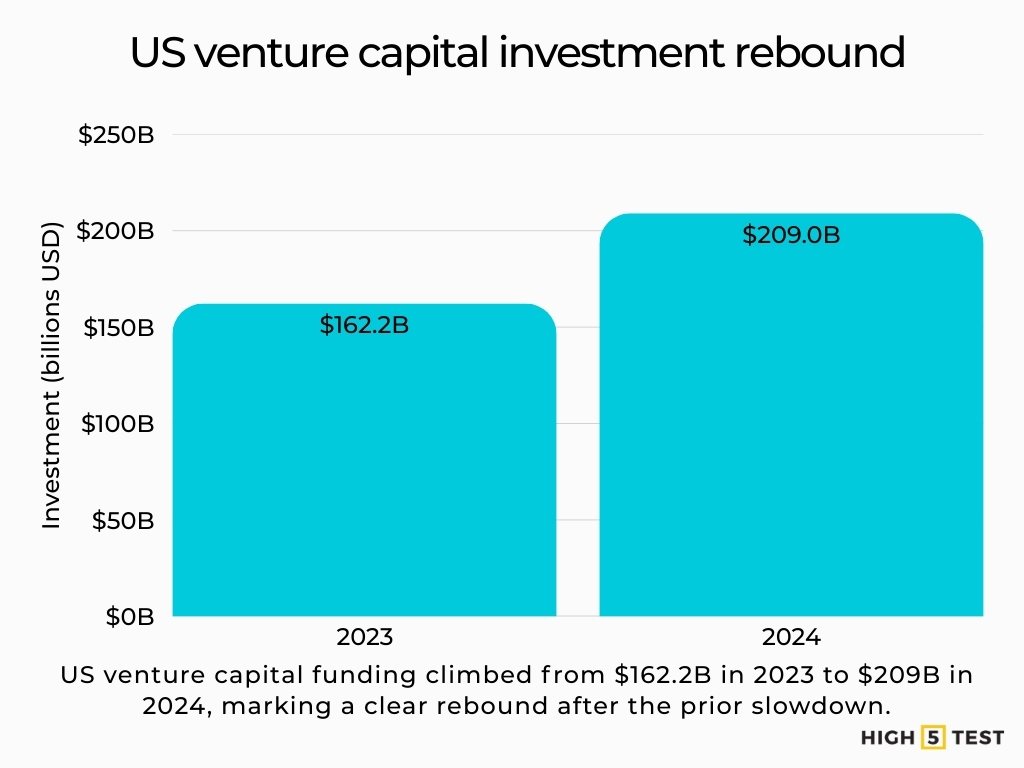
Source: KPMG
Global VC investment of about $368 billion in 2024, with the Americas attracting $78.7 billion in Q4 alone and the US accounting for $74.6 billion of that quarter’s activity, its highest quarterly level in ten quarters.
Source: KPMG
Another study finds global startup funding reached roughly $314 billion in 2024, up about 3% from 2023. It also notes the lift was driven largely by AI mega deals, not a uniform recovery.
Source: Crunchbase
Over 80% growth in AI funding between 2023 and 2024 resulted in nearly one-third of all VC dollars going to AI-related startups, with just four firms (xAI, Databricks, Anthropic, OpenAI) taking about $40 billion (~13% of total VC funding) in 2024 alone.
Source: CNBC
Global startup funding in the first half of 2025 rose to about $91 billion, an 11% increase year over year but a 20% drop quarter to quarter. Again, heavily concentrated in AI and a handful of late-stage deals, suggesting a “rich get richer” dynamic at the top of the market.
Source: Crunchbase
Round sizes and time between rounds
A funding-rounds analysis reports that the median US seed round in 2024 was about $3.5 million, up from 17% from Q4 2023, while median Series A rounds increased to $9.3 million (from ~$8M in 2023).
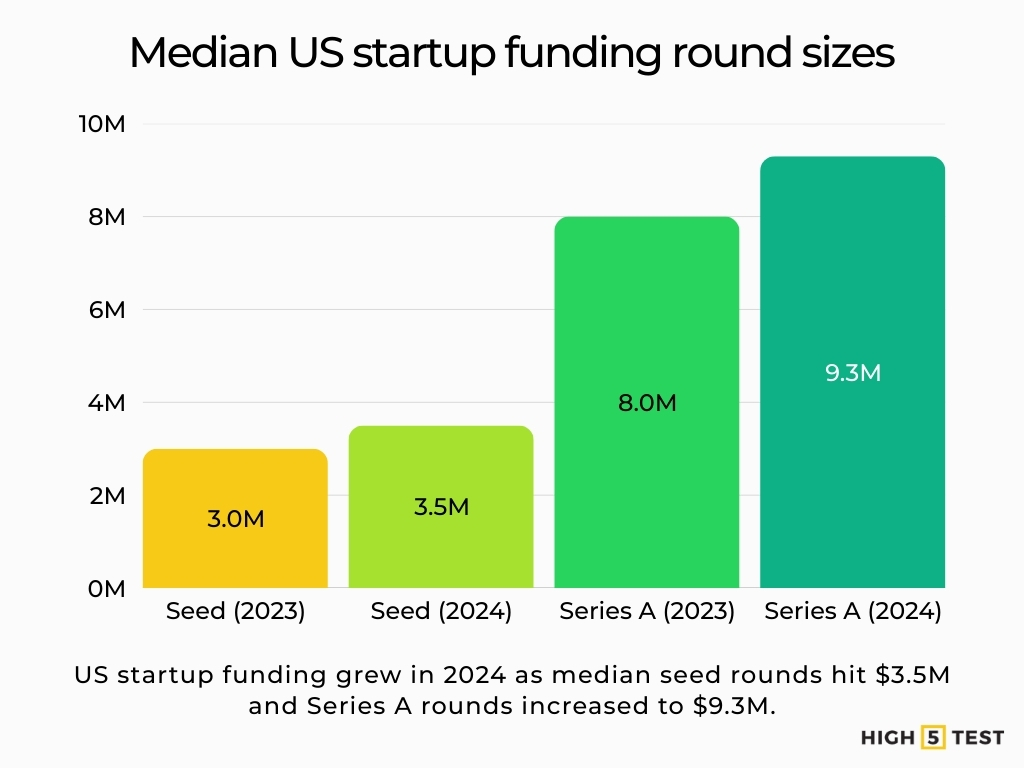
Source: Carta
The median time between funding rounds increased from about 451 days in 2021 to 744 days in Q4 2024, reflecting tougher fundraising conditions and longer paths to growth.
Source: Carta
Despite the overall rebound, many founders still face a “barbell” environment where large late-stage and AI rounds skew averages upward while smaller, earlier-stage rounds remain harder to close and take longer, often well over 18–24 months between raises.
Source: Mercury
Gender and funding gaps
Female-founded companies in the US raised $38.8 billion in 2024, a 27% year-over-year increase, yet their share of total VC deal count and value actually declined versus 2023.
Source: PitchBook
Companies founded solely by women captured only about 1–2% of total US venture capital in 2024, down from roughly 2% in 2023, despite representing a larger share of exits and often stronger capital efficiency.
Source: PitchBook
Globally, all-female founding teams received just 2.3% ($6.7 billion) of the $289 billion in VC deployed in 2024, with all-male teams taking 83.6% ($241.9B) and mixed-gender teams 14.1% ($40.7B).
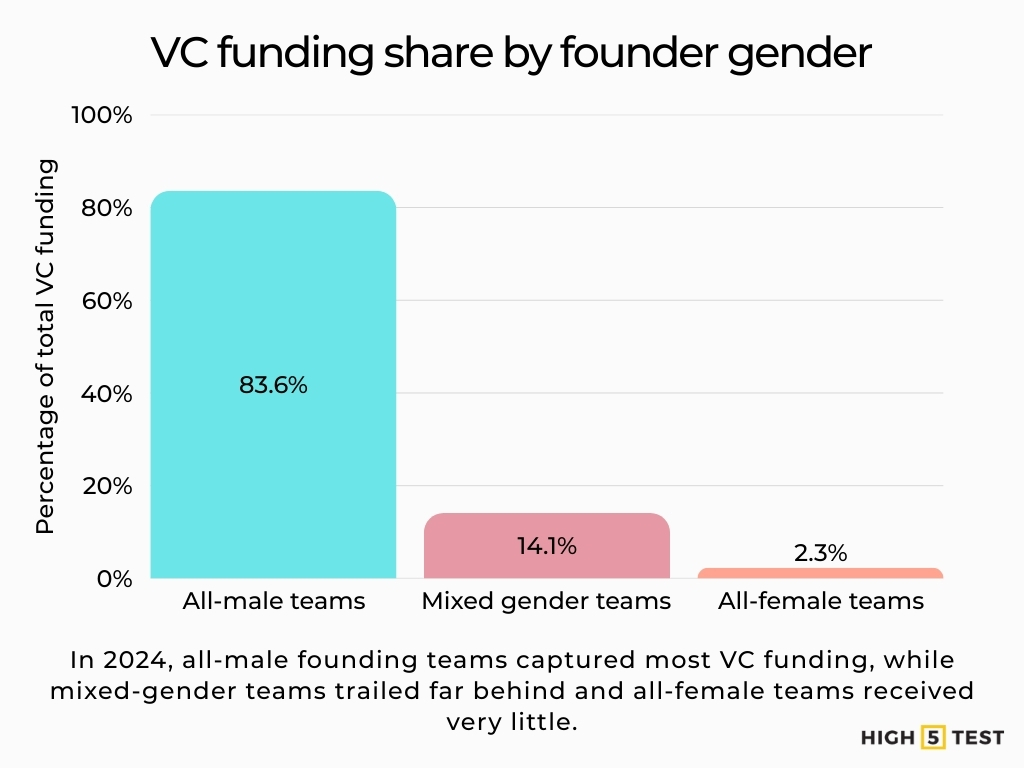
Source: Founders Forum Group
Women represented 14.3% of new founders on Carta in 2024, down slightly from 14.5% in 2023 and below the 15.9% peak reached in 2020, indicating that the pipeline of funded women founders remains narrow.
Source: Carta
Data on founders of US startups
Founder demographics are diversifying, even as funding outcomes still lag.
Gender and race among founders
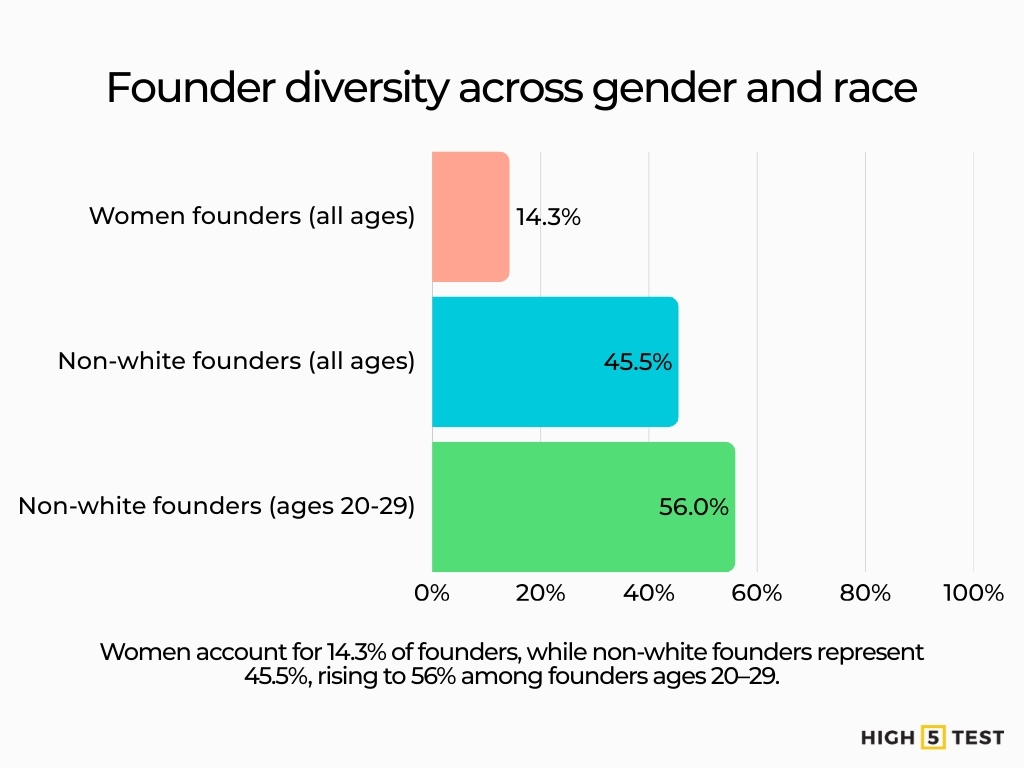
Women make up 14.3% of founders on its platform, while founders from non-white backgrounds account for a record 45.5% of the total, and among younger founders (ages 20–29), 56% identify as non-white, pointing to increasingly diverse early-stage founder cohorts.
Source: Carta
In the broader small business population, women started 49% of new US businesses in 2024, up from 29% in 2019, even though women continue to receive far less equity financing and rely more heavily on debt and personal savings.
Source: Gusto
Women own about 43.2% of US small businesses. This indicates that gender gaps are largest in funding and scaling, not in baseline entrepreneurial intent.
Source: NAWBO
Solo founders vs co-founding teams
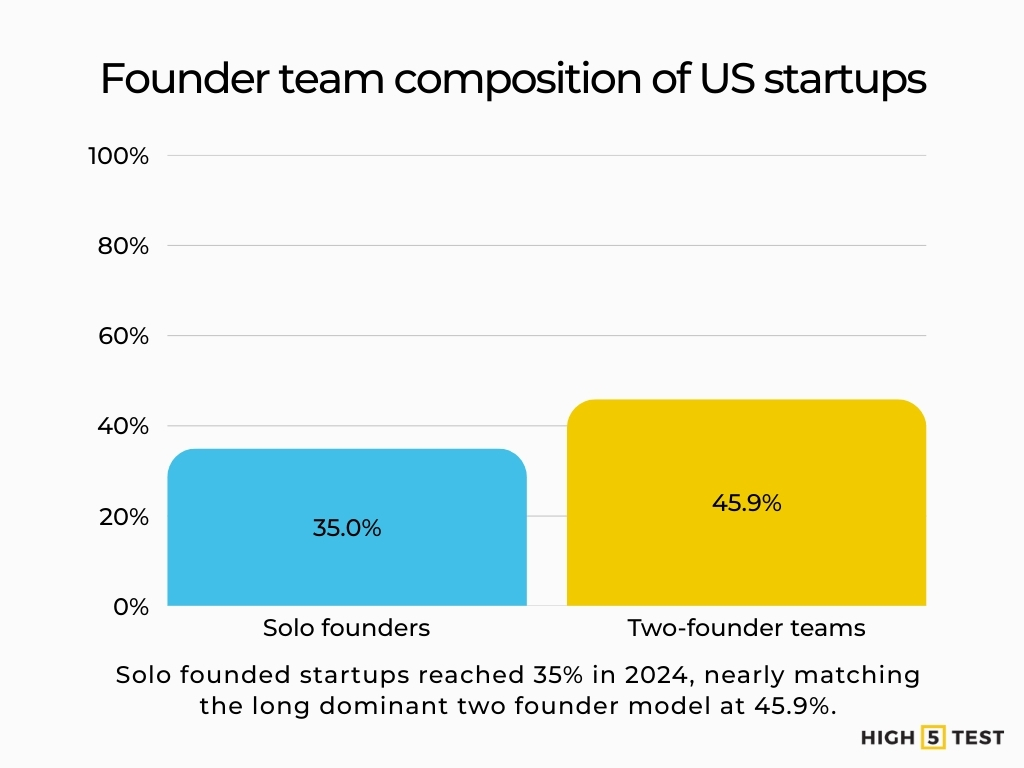
35% of US startups in 2024 were founded by solo founders, more than double the share a decade earlier, approaching the 45.9% share held by two-founder teams, historically the most common configuration.
Source: Carta
Only about 17% of solo-founded startups had secured venture funding in 2024, versus substantially higher funding rates for multi-founder teams, evidence of an ongoing investor preference for broader founding teams even as generative AI makes solo building more viable.
Source: Carta
Data on teams, jobs, and the economic impact of startups
Small firms drive a large share of job growth, even though many have no employees.
Jobs created by small and young firms
Small businesses (generally firms with <500 employees) employ about 45.9% of private-sector workers, equating to 59 million jobs, depending on the specific year and dataset.
Source: U.S. Small Business Administration
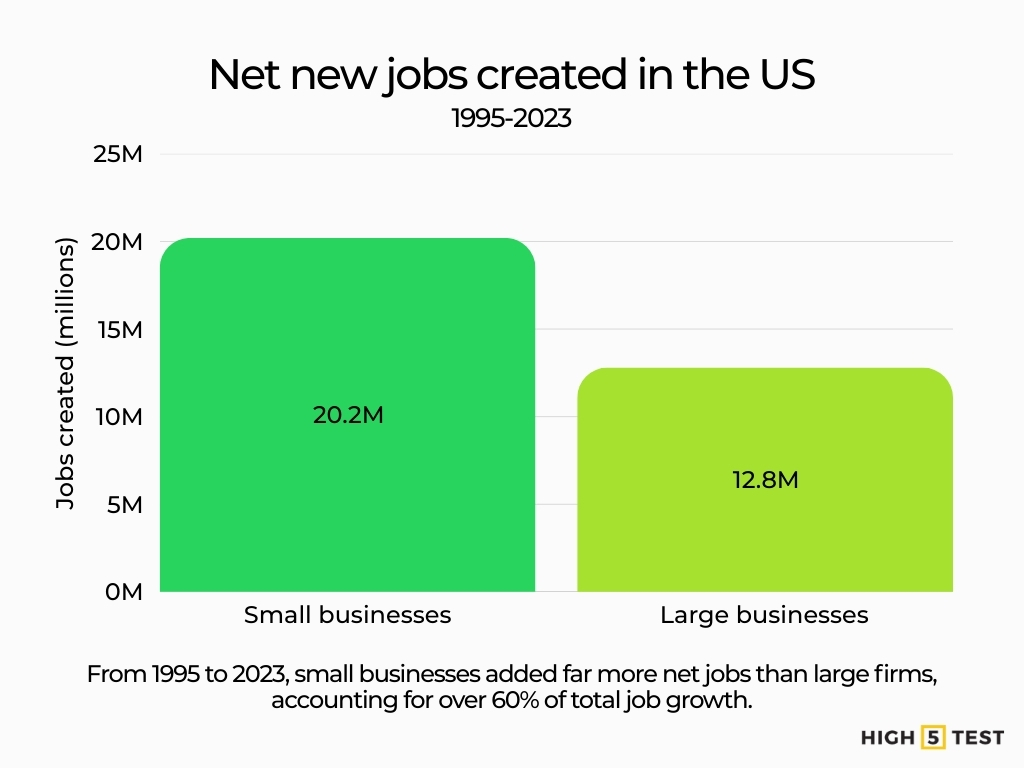
From 1995 to 2023, small businesses created 20.2 million net new jobs, about 61.1% of all net new jobs, while large businesses created 12.8 million, showing that smaller firms punch far above their weight in employment growth.
Source: U.S. Small Business Administration
Small businesses with 249 or fewer employees contributed 52.8% of net job creation between 2021 and 2024, underscoring their central role in post-Great Recession and post-COVID recovery.
Source: Bureau of Labor Statistics
Since 2019, small businesses have provided about 70% of net new American jobs, up from 64% in the previous business cycle, reflecting the outsized contribution of new and small firms in the most recent expansion.
Source: U.S. Department of the Treasury
How “lean” are new startups?
Small-business employment stats suggest that ~81.9% of US small businesses are “nonemployer” firms with no employees, yet those that do employ people still manage to employ over 60 million workers, showing that a small share of employer-startups drives most job creation.
Source: U.S. Small Business Administration
Work models and flexibility in startup-sized firms
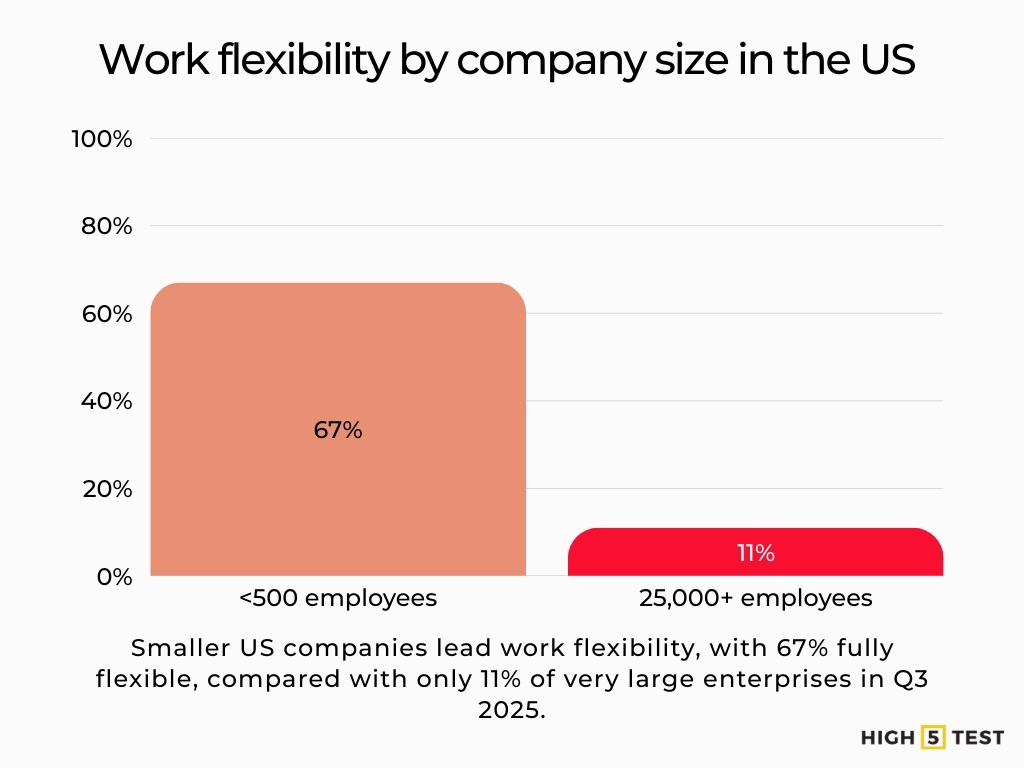
As of Q3 2025, about 67% of US companies with fewer than 500 employees are “fully flexible”, whereas only about 11% of enterprises with 25,000+ employees have that level of flexibility, suggesting smaller and younger firms remain the vanguard of remote and hybrid work.
Source: Flex Index
Broader workforce surveys show that 26% of US full-time employees are fully remote and about 52% work in a hybrid model as of 2025, meaning roughly five in ten knowledge workers now have at least some remote flexibility, a structural tailwind for distributed-first startups.
Source: Gallup
Statistics on unicorn and hypergrowth startups
Unicorns get the headlines, but they remain outliers, even in a strong market.
How many unicorns, and where?
Over 1,300 unicorn companies globally as of November 2025, with a combined valuation of about $5443 trillion.
Source: CB Insights
Within that, the United States hosts 702 unicorns worth about $3.2 trillion, followed by China with 302 unicorns worth $1.4 trillion and India with 119 unicorns worth $0.4 trillion, meaning US startups account for ~58% of global unicorn count and ~54% of total unicorn valuation.
| Country | Number of Unicorns | Valuation |
| United States | 702 | $3.2 trillion |
| China | 302 | $1.4 trillion |
| India | 119 | $0.4 trillion |
Source: Founders Forum Group
Adjusted for population, the US has about 2.12 unicorns per million people, which, while high, trails Israel (2.77) and Singapore (2.39), underscoring that several smaller ecosystems are even more unicorn-dense.
Source: Founders Forum Group
Within the US, unicorn formation is highly concentrated: California hosts 384 unicorns (~55% of the US total), New York 127 (18%), Massachusetts 45 (6%), Texas 37 (5%), and Florida 20 (3%), leaving 89 unicorns (~13%) spread across the remaining 21 states.
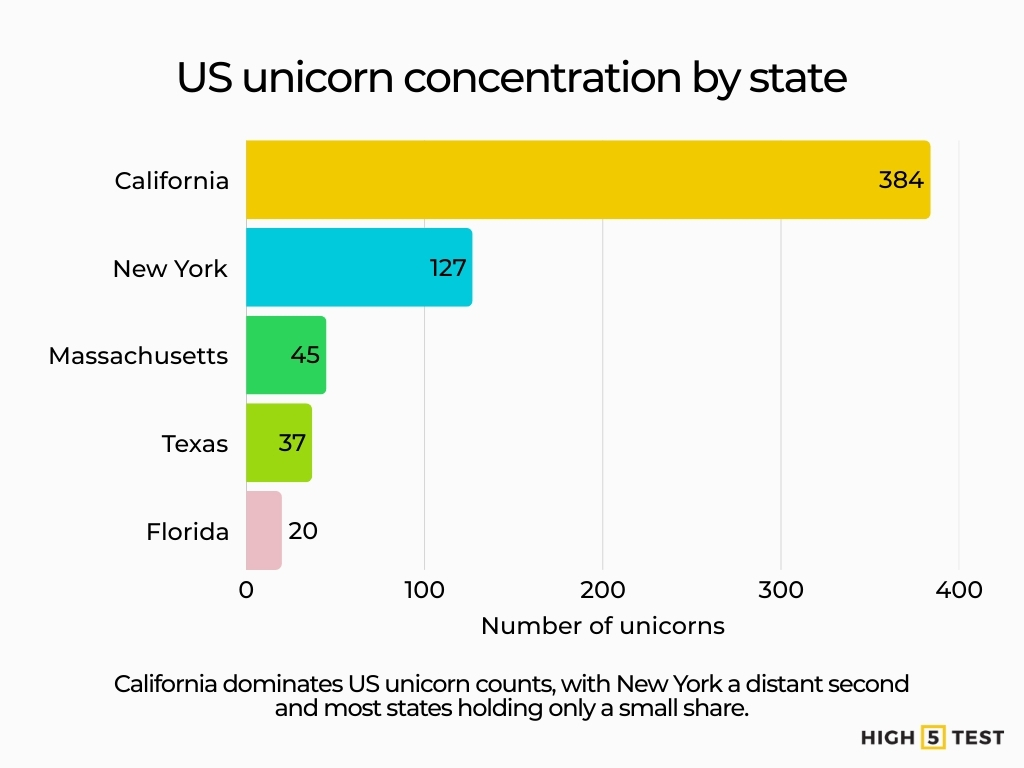
Source: Founders Forum Group
Sectors and the AI surge
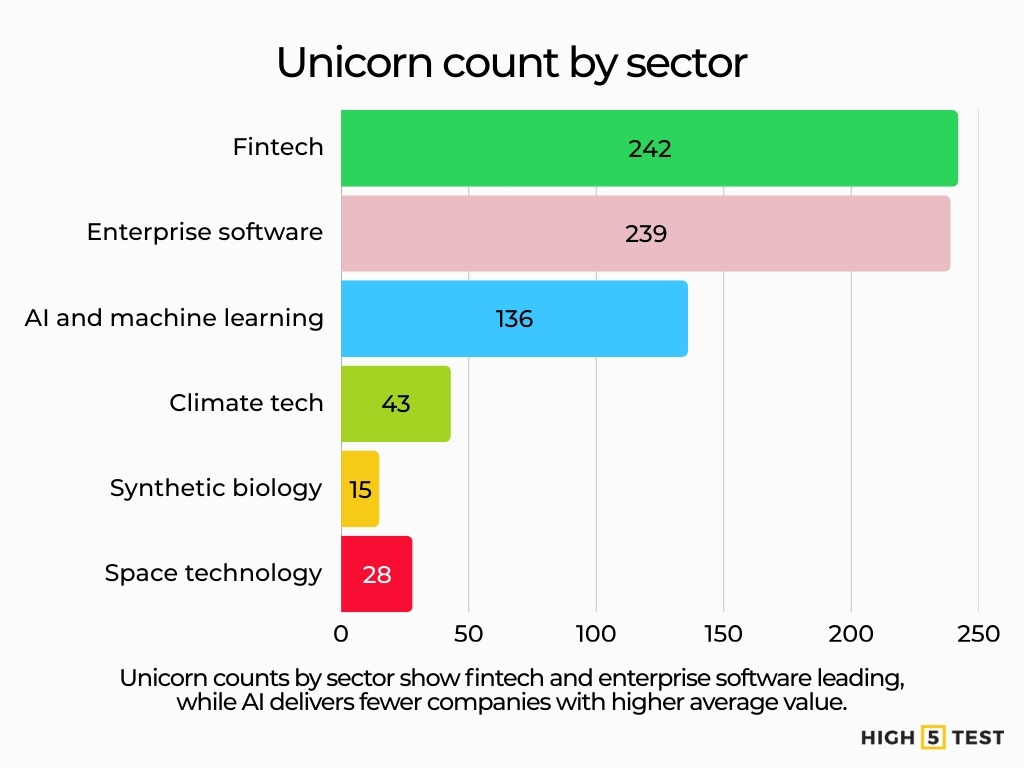
By sector, fintech has 242 unicorns (16% of total) valued at about $950 billion, while enterprise software has 239 unicorns (15.7%) valued at ~$880 billion.
AI/machine learning unicorns number 136 (9% of unicorns) but account for ~$955 billion in value (~16% of total unicorn valuation), giving them the highest average valuation (~$7.0 billion) of any major unicorn sector.
Emerging categories such as climate tech (43 unicorns, up from 12 in 2021), space technology (15, up from 5 in 2021), and synthetic biology (28, up from 9 in 2021) have seen some of the fastest unicorn growth rates since 2021, signaling where the next wave of outsized outcomes may emerge.
Source: Founders Forum Group
Odds and timelines to unicorn status
The probability of building a company worth more than $1 billion is about 0.00006% (roughly 3 in 5 million) for the average new company.
Source: First Round
Just over 1% of VC-backed startups ever become unicorns.
Source: Tech Crunch
The all-time average time to unicorn status is ~7.2 years (median ~6.7 years), with AI/ML unicorns reaching $1B valuations in an average of 3.4 years, versus 5.9 years for fintech and 6.8 years for enterprise SaaS, reflecting the compressed timelines in the current AI cycle.
Source: Founders Forum Group
What these startup statistics mean for founders in 2025
The data points to a market that rewards focus, cash discipline, and realistic planning.
Survival is hard but not hopeless: Data shows that about half of new establishments survive at least five years, and roughly one-third are still around after ten, meaning the base case is not inevitable failure, but success almost always requires surviving multiple years of incremental gains.
Source: Bureau of Labor Statistics
Funding is abundant but concentrated: While US VC deployment bounced back to ~$209B in 2024 and global funding to ~$314B, AI and a handful of mega-rounds dominate, and the median time between rounds is now 2+ years, so founders should plan for longer runways and more disciplined unit economics.
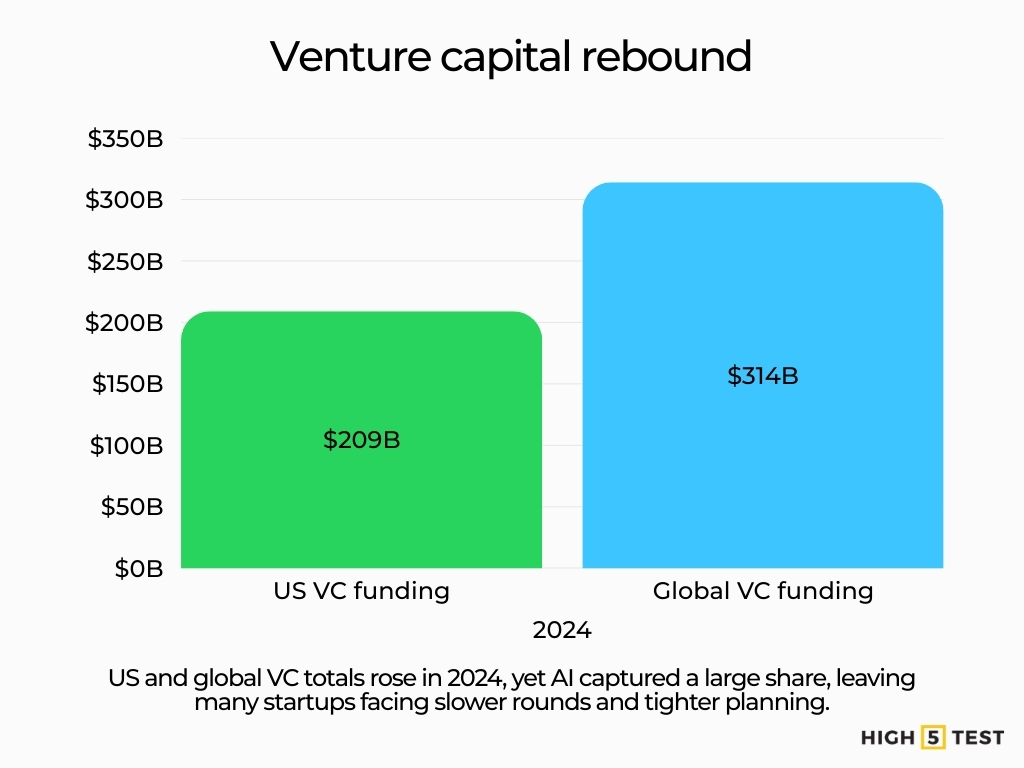
Source: KPMG, Crunchbase
Diversity is rising at the founder level but lagging in capital allocation: Women now start nearly half of new US businesses (49%), and 14.3% of funded founders on Carta are women, yet all-female teams still receive only around 1–2% of US VC dollars, a stark mismatch that both investors and founders can treat as an opportunity gap.
Source: Gusto, Carta, Pitchbook
Unicorns are more common than in 2013, but still extremely rare: With 818 US unicorns and ~1,334 worldwide, the club has grown dramatically, but a low conversion among VC-backed startups underlines that founders should optimize for building durable, cash-efficient companies first, and treat unicorn status as a by-product rather than the core goal.
Source: Failory, CB Insights
Conclusion
Startup creation is high, and the competition is real. Longer fundraising cycles and uneven capital access mean you win by building what customers will pay for and by managing cash with care. Use these statistics as planning anchors. Set runway targets that match current timelines, and measure progress against realistic benchmarks.