Workplace diversity in the U.S. continues to change in ways that reveal both progress and persistent gaps. Representation has improved in parts of the workforce, yet barriers remain in leadership access, pay equity, promotion rates, and everyday workplace experience, particularly for women, people of color, disabled workers, and those with intersecting identities.
This article compiles current U.S. workplace diversity statistics from 2024 to 2025 to clarify where gains are holding, where momentum is slowing, and why early pipeline decisions, work models, and compliance risk now shape long-term equity and organizational performance.
10 most interesting workplace diversity statistics
- Disability unemployment gap: unemployment 9.4% for people with disabilities vs ~4.1% for people without disabilities (2025).
- Disability employment level: employment–population ratio 38.2% for people with a disability (2025).
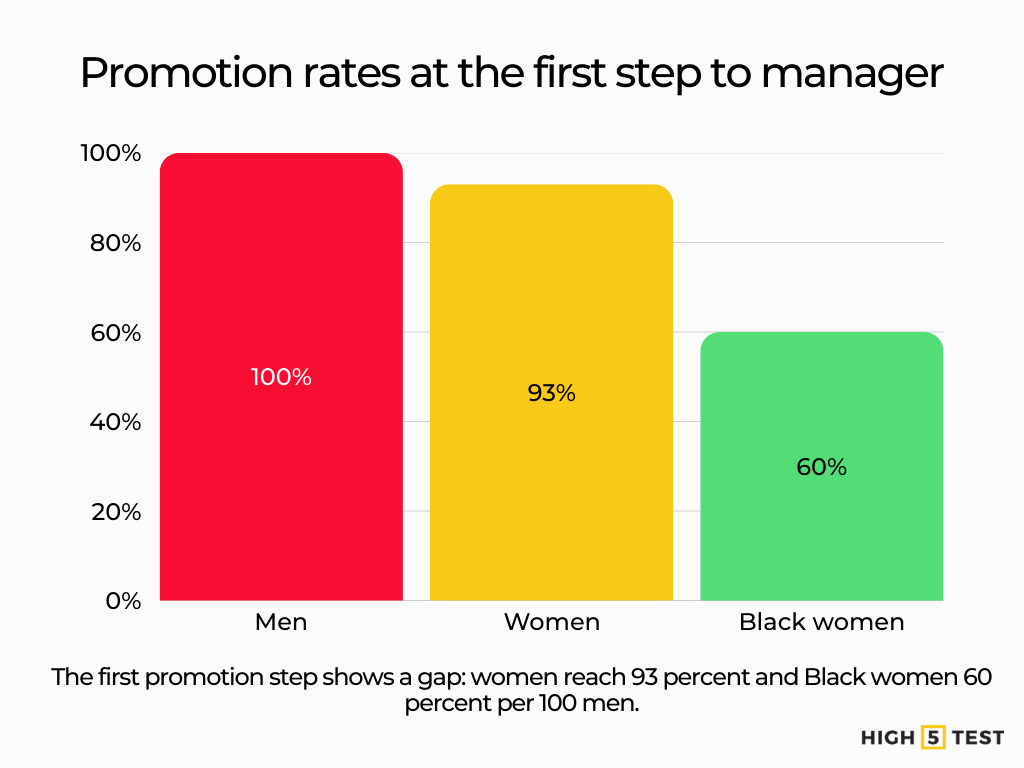
- “Broken rung” (promotion to manager): for every 100 men promoted, only 93 women and only 60 Black women are promoted.
- Women of color in leadership: women of color hold only ~7% of C-suite roles (2025).
- Discrimination charges rising: FY2024 recorded 88,531 discrimination charges, up 9.2% from FY2023.
- Retaliation dominates: retaliation was the most common claim with 42,301 filings (FY2024).
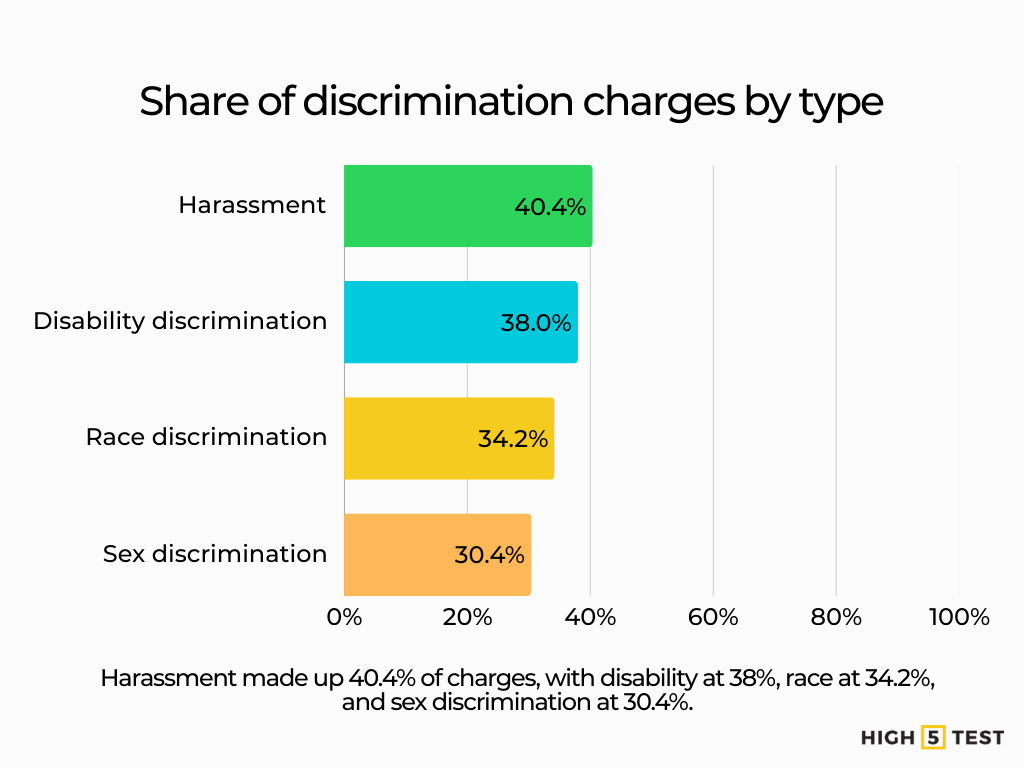
- Harassment share is massive: harassment appeared in ~40.4% of charges.
- Pay equity depends on how you measure it: women earned ~95¢ per $1 (hourly, 2024), but ~81¢ per $1 (full-time year-round earnings).
- Inclusion lever many companies overthink: ~61% of workplace accommodations cost $0, and the median one-time cost is ~$300.
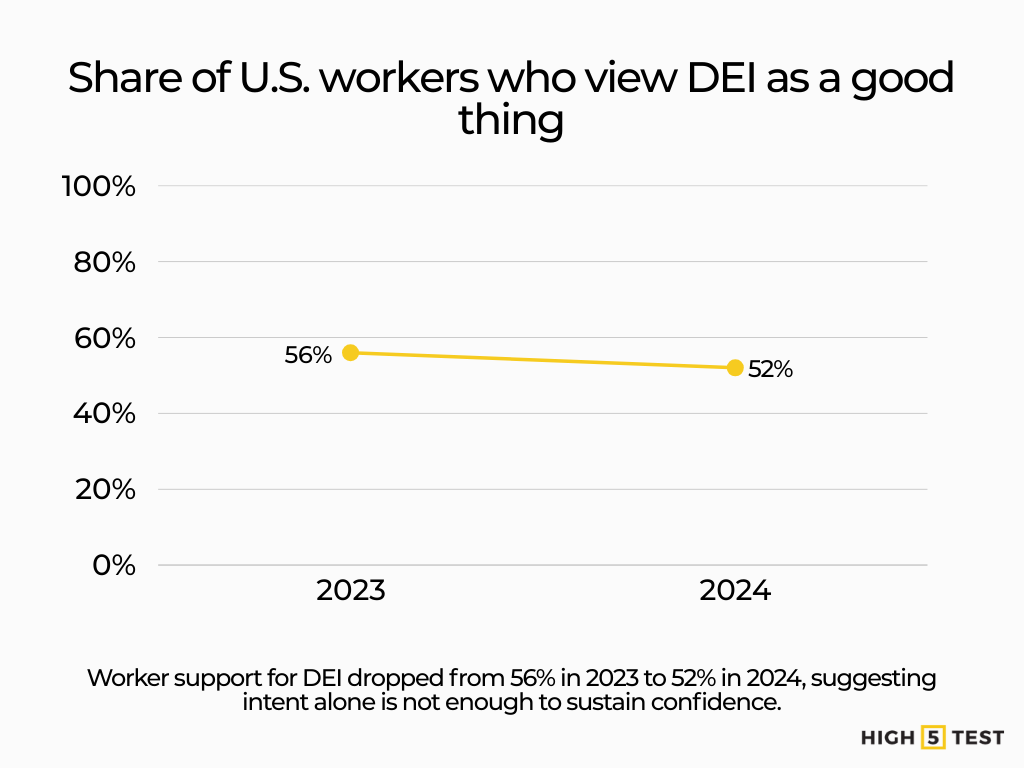
- DEI sentiment softened: 52% of U.S. workers said a DEI focus is mainly a good thing (down from 56% in 2023).
Workplace diversity statistics in the US (2024/2025)
Gender and overall composition
Women remain close to half of the workforce at about 47% of employed workers in 2024. Women’s labor-force participation was about 57.6% in May 2024. That suggests many women are still outside the labor market compared with pre-pandemic norms.
Source: US Department of Labor, US Chamber of Commerce
Race and ethnicity
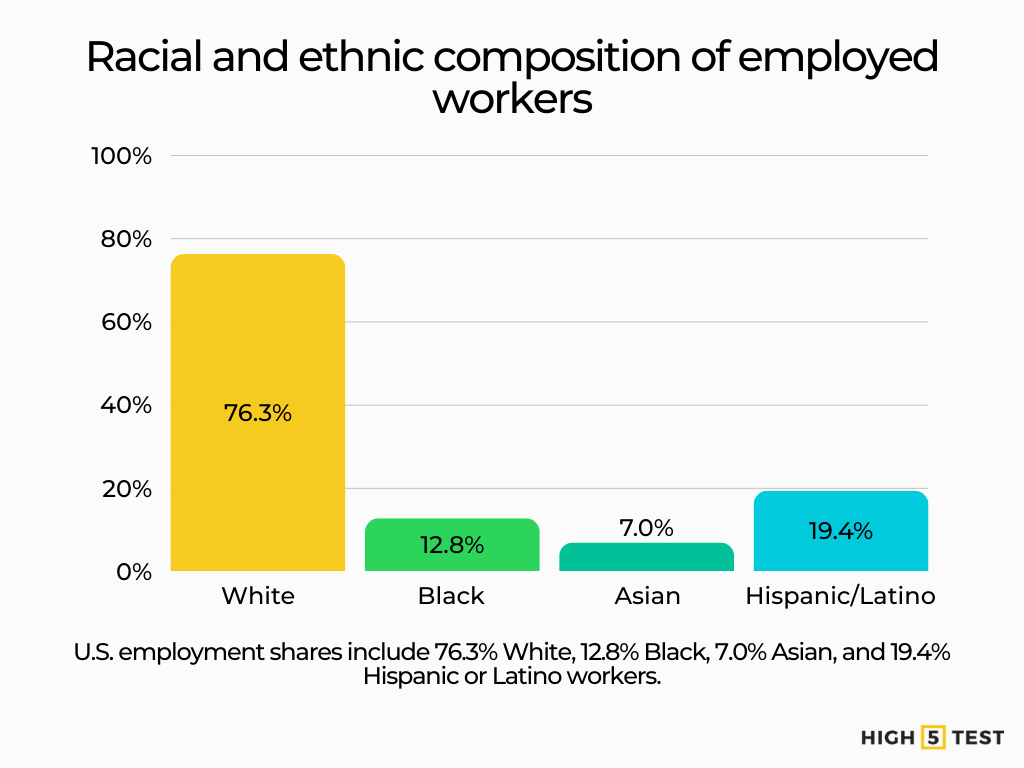
Commonly cited breakdowns show roughly 76.3% White, 12.8% Black, 7.0% Asian, and 19.4% Hispanic or Latino among employed workers. Hispanic or Latino is counted across races. These shares show why single-category reporting can miss overlap.
Source: Bureau of Labor Statistics
Age and other demographics
Older age groups are increasing their share of the labor force. The growth of the 55+ workforce segment continues to shape diversity across age, and has been the fastest-growing age group in the labor force for more than two decades.
Source: United States Census Bureau
People with disabilities
In 2025, the employment-population ratio for people with a disability was 38.2%. Unemployment was 9.4% for people with disabilities and about 4.1% for people without disabilities. The gap points to barriers in hiring and retention, not just job search outcomes.

Source: US Department of Labor
LGBTQ+ identification
Data showed 9.3% of U.S. adults identified as LGBTQ+. While not limited to the workforce, this figure signals inclusion considerations for employers.
Source: Gallup
Workplace diversity data by representation and leadership
By occupation and management level
Women’s representation in the corporate pipeline continues to improve, yet declines markedly as roles become more senior.
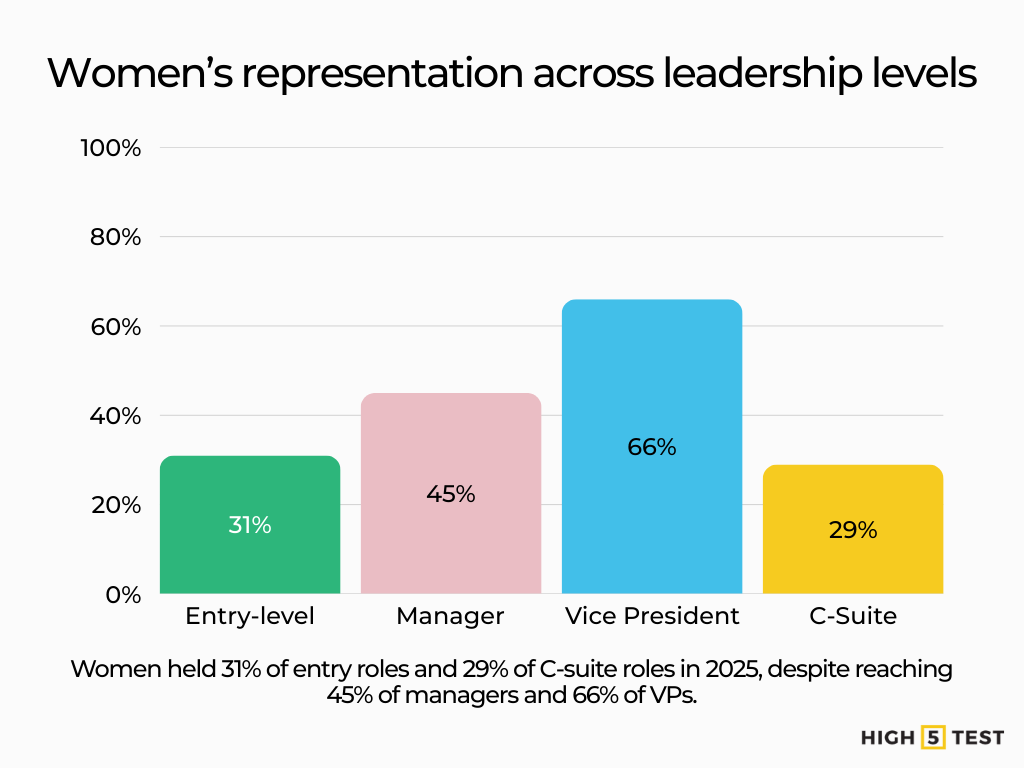
Entry level: 31% women in 2025 (from ~45% in 2015). That low starting point limits the pool for future leadership.
Source: LeanIn.Org and McKinsey
Manager: 45% women in 2025 (from ~37% in 2015). The manager level is where promotion patterns start to compound.
Source: LeanIn.Org and McKinsey
Vice President: 66% women in 2025 (from ~27% in 2015). If your organization does not see a similar pattern, the issue may sit in the function mix or reporting definitions.
Source: LeanIn.Org and McKinsey
C-suite: 29% women in 2025 (from ~17% in 2015). The top tier remains far from parity.
Source: LeanIn.Org and McKinsey
Only 74 women of color are promoted for every 100 men. That shortfall can widen quickly across multiple promotion cycles.
Source: LeanIn.Org and McKinsey
Corporate boardrooms and CEO roles
Despite progress, the top leadership tiers remain far from parity. For example:
Women held about 29% of C-suite positions in 2024.
Source: LeanIn.Org and McKinsey
The “broken rung” persists: for every 100 men promoted to manager, only 93 women, and only 60 Black women. This early gap often explains later leadership imbalance.
Source: LeanIn.Org and McKinsey
Key insight
Senior leadership gaps rarely come from a single decision. They build from early promotion patterns, uneven access to high-visibility work, and inconsistent sponsorship.
Workplace diversity statistics by pay and equity gaps
Gender pay gap
Women earned about 95 cents for every dollar earned by men in 2024 on an hourly basis. Annual earnings show a wider gap.
Source: Pew Research Center
A broader measure shows women earned about 81 cents for every dollar men earned in full-time, year-round jobs.
Source: AAUW
By race/ethnicity
Companies and researchers point to persistent gaps for women of color compared to white women and men. Women made 83% of every dollar made by white, non-Hispanic men in 2023.
Source: AAUW
Key insight
Representation gains alone don’t translate into parity in compensation. Organizations that wish to lead on equity must tackle root variables such as role type, hours, pay transparency, and bias.
Workplace diversity in experience, risk, and compliance
Discrimination and harassment trends
FY 2024 recorded 88,531 discrimination charges, up 9.2% from FY 2023. A rise like this can signal more conflict, more reporting, or both.
Source: U.S. Equal Employment Opportunity Commission
Retaliation remained the most common claim with 42,301 filings in FY 2024. Retaliation trends often track manager training quality and reporting processes.
Source: U.S. Equal Employment Opportunity Commission
Harassment appeared in about 40.4% of charges. Disability discrimination appeared in 38%. Race discrimination appeared in 34.2%. Sex discrimination appeared in 30.4%. These shares show where policy, training, and investigations tend to face the most pressure.
Source: NT LAKIS
Public sentiment and DEI focus
Research found that 52% of U.S. workers said a focus on diversity, equity, and inclusion is mainly a good thing. The share was 56% in 2023. The decline suggests that messaging and implementation matter as much as intent.
Source: Pew Research Center
Key insight
As charges increase, the reputational, legal, and operational risk for organizations escalates. Promoting inclusion, tackling harassment, and preventing retaliation are critical parts of a workplace diversity strategy.
Statistics on work models and inclusion enablers
Remote/hybrid work and access
Flexible work remains a key lever for inclusion. In Q1 2025, about 21.9% of U.S. workers teleworked from home.
Source: Bureau of Labor Statistics
Disability accommodation
About 61% of workplace accommodations cost $0, and the median one-time cost remains about $300. Many adjustments are low cost, so delays often come from process issues rather than budget limits.
Source: Job Accommodation Network
Key insight
Work-model flexibility and inclusive accommodation strategies matter as much as representation. They affect access, retention, and equity outcomes – especially for disabled workers, caregivers, and others.
Intersectionality call-outs data
Women of color hold only ~7% of C-suite roles in 2025. This shows why a single gender metric can hide major gaps.
Source: LeanIn.Org and McKinsey
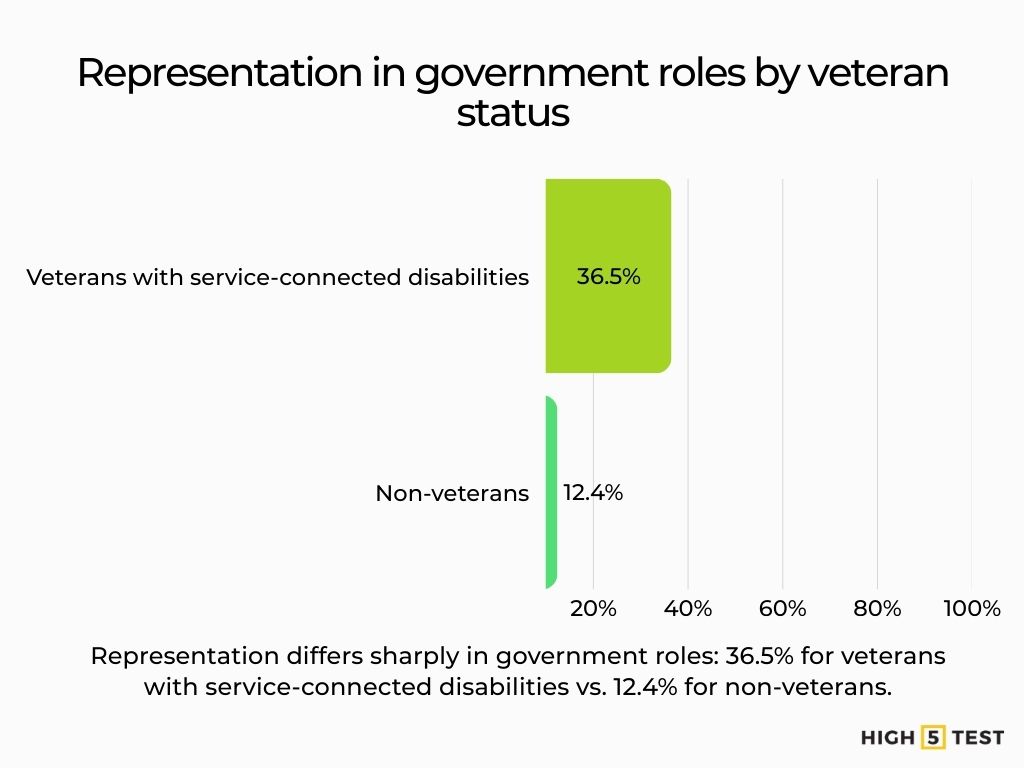
Veterans with service-connected disabilities are disproportionately represented in some government roles (~36.5%) vs. non-veterans (~12.4%) as of Aug 2024. That contrast can guide targeted recruiting and retention plans.
Source: Bureau of Labor Statistics
Key insight
Diversity isn’t one-dimensional. organizations must consider intersecting identities (gender + race/ethnicity + disability + veteran status + sexual orientation) to achieve meaningful equity.
What this means for organizations
1. Representation is improving in parts of the pipeline. Senior levels still lag for women, people of color, disabled employees, and LGBTQ+ workers.
2. Pay and promotion gaps remain. Many gaps start at the first manager promotion and compound over time.
3. Workplace culture and work models shape outcomes. Flexibility, accommodation processes, and anti-harassment work support retention and trust.
4. Data, transparency, and accountability are important. Track internal metrics, publish dashboards where appropriate, and tie progress to leadership goals.
5. Intersectional analysis needs attention. Programs that focus on one identity can miss layered inequities.
6. Risk and compliance pressures are rising. The increase in filings is a signal to tighten practices and manager training.
FAQ
What is the “broken rung”?
A: It refers to the drop-off faced by women (particularly women of colour) at the first promotion to manager. For every 100 men promoted to manager, only 91 women are promoted – and only 60 Black women.
Source: LeanIn.Org and McKinsey
Does representation in entry-level roles guarantee senior leadership diversity?
No. Women make up 31% of entry-level roles in the 2025 data; while their representation rises to ~66% at the VP level, it drops to ~29% in the C-suite.
Source: LeanIn.Org and McKinsey
Are pay gaps closing?
Slowly. On an hourly measure, women earned ~95 cents per dollar in 2024. On full-time annual earnings, the figure is ~81 cents. Significant work remains.
Source: Pew Research Center, AAUW
Why do discrimination charges matter for DEI strategy?
They reflect underlying culture, policy, and inclusion issues that may expose organizations to reputational and financial risk. In FY 2024, EEOC filings rose ~9.2%.
Source: EEOC
Conclusion
2024 and 2025 mark a turning point for workplace diversity in the U.S. Representation and inclusion policies continue to improve. Leadership access, pay equity, day-to-day experience, and intersectional outcomes still show wide gaps. Organizations that go past surface metrics tend to make faster progress. They set clear targets, share data transparently, build inclusive leadership habits, support flexible work, expand sponsorship, and measure outcomes across intersecting identities.
If you want real change, treat these numbers as action prompts. Review your hiring and promotion pipeline. Audit pay by level and function. Measure inclusion through culture and experience signals. Tie leader expectations to results and follow through. The trend lines show one message clearly. Delay usually widens the gap.