College enrollment statistics reveal how higher education in the United States is changing in real time. In 2024 and 2025, US colleges and universities recorded their first sustained enrollment growth in more than a decade, signaling a slow recovery from pandemic-era declines. Using the most recent data from, this report analyzes total college enrollment, demographic trends, online learning growth, and future projections.
The result is a clear, data-backed snapshot of how many students are enrolled in college today and what those numbers mean for the future of higher education.
10 most interesting college enrollment statistics
- Total U.S. college enrollment reached 19.4 million in fall 2025, marking a 1.0% increase from the prior year.
- Undergraduate enrollment grew 1.2%, even as graduate enrollment slightly declined by 0.3% in the same period.
- Community college enrollment increased by ~3.0%, outpacing growth at other institution types.
- Public four-year universities accounted for about 41% of total enrollment with ~7.9 million students.
- Women made up roughly 55–58% of total enrollment in fall 2025, continuing a longstanding gender gap.
- 45.23% of all postsecondary students were students of color in fall 2022, up nearly 30 percentage points since 1976.
- Students aged 30 and older comprised 16% of total enrollment in fall 2025, highlighting growth in non-traditional learners.
- Business majors accounted for 17.7% of undergraduates at four-year institutions in fall 2025, making it the most popular field of study.
- Nearly 5 million students (~25% of total enrollment) were enrolled exclusively online as part of the post-pandemic shift in learning formats.
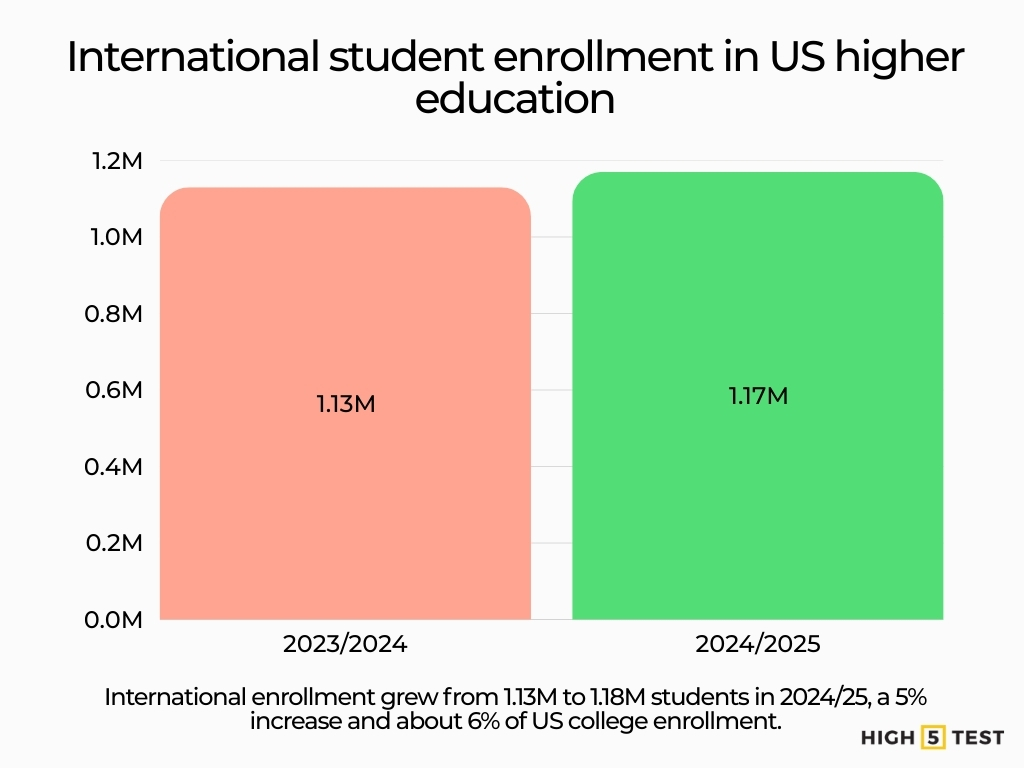
- International student enrollment hit 1,177,766 in 2024/25, a 5% increase, contributing about $42.9 billion and supporting 355,736 jobs to the U.S. economy.
40+ college enrollment statistics in the U.S. (2024/2025)
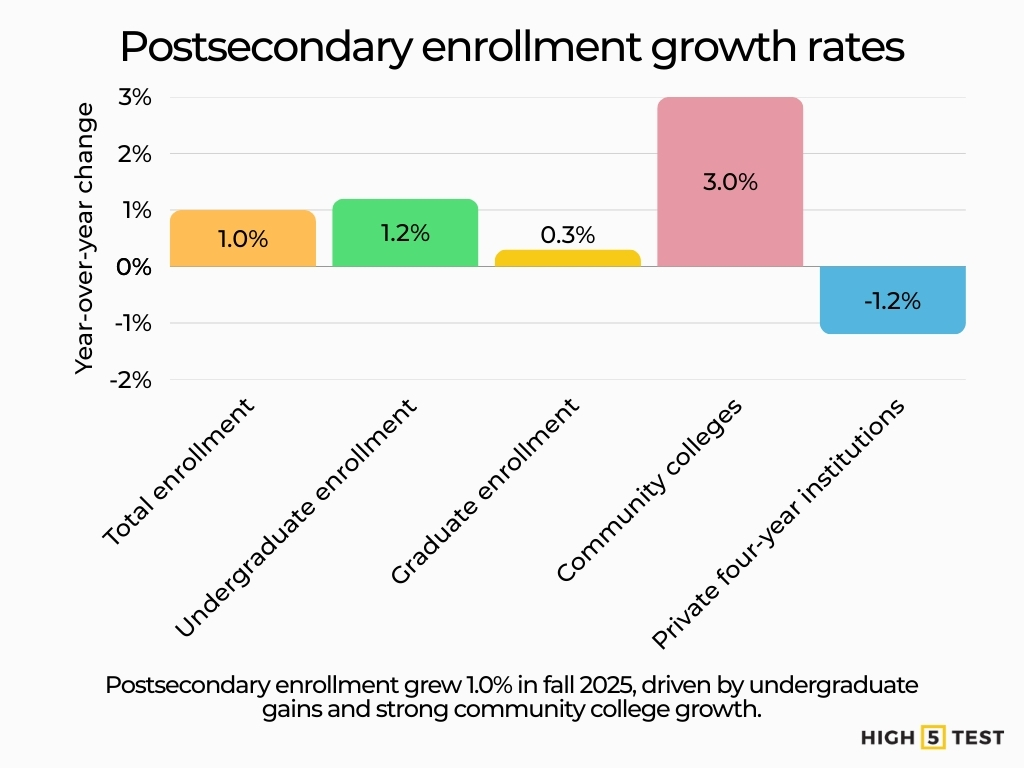
College enrollment is rising again after more than a decade of contraction.
Postsecondary enrollment reached 19.4 million students in fall 2025, a 1.0% increase from the prior year. Undergraduate enrollment grew 1.2%, while graduate enrollment declined slightly by 0.3%. Community colleges accounted for much of the growth, with enrollment up 3.0%. Private four-year institutions continued to post undergraduate losses.
Enrollment momentum has slowed as the recovery matures. Freshman enrollment held nearly flat at –0.2%. Public four-year institutions gained students, while private institutions and some graduate programs saw declines, including among international graduate students.
The rebound phase has ended, and enrollment is settling into a period of modest and uneven growth.
Source: National Student Clearinghouse Research Center
Statistics on projected enrollment growth
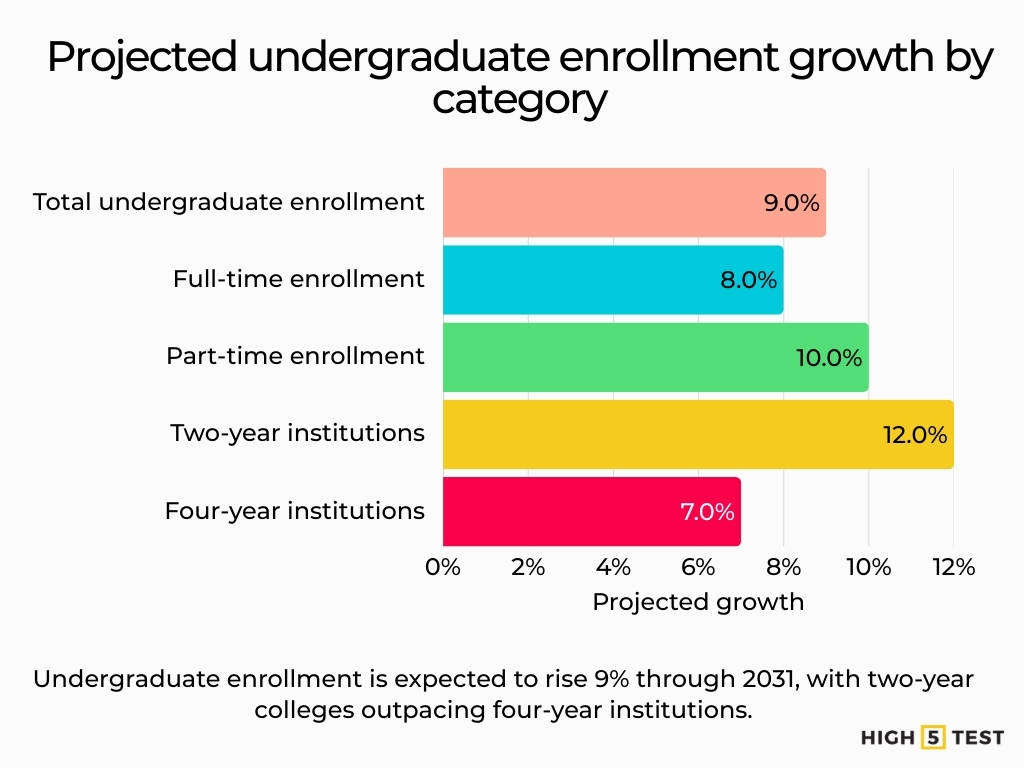
Future growth is expected to remain moderate rather than return to earlier expansion levels.
Undergraduate enrollment is projected to rise 9% between 2021 and 2031, increasing from 15.4 million to 16.8 million students. Full-time enrollment is expected to grow by about 8%, while part-time enrollment may increase by 10%. Two-year institutions are projected to grow faster, around 12%, than 7% for four-year institutions.
Enrollment growth is likely to continue, but gains will depend heavily on institution type and student demographics.
Source: National Center for Education Statistics
Statistics on enrollment by type of institution
Public vs. private institutions
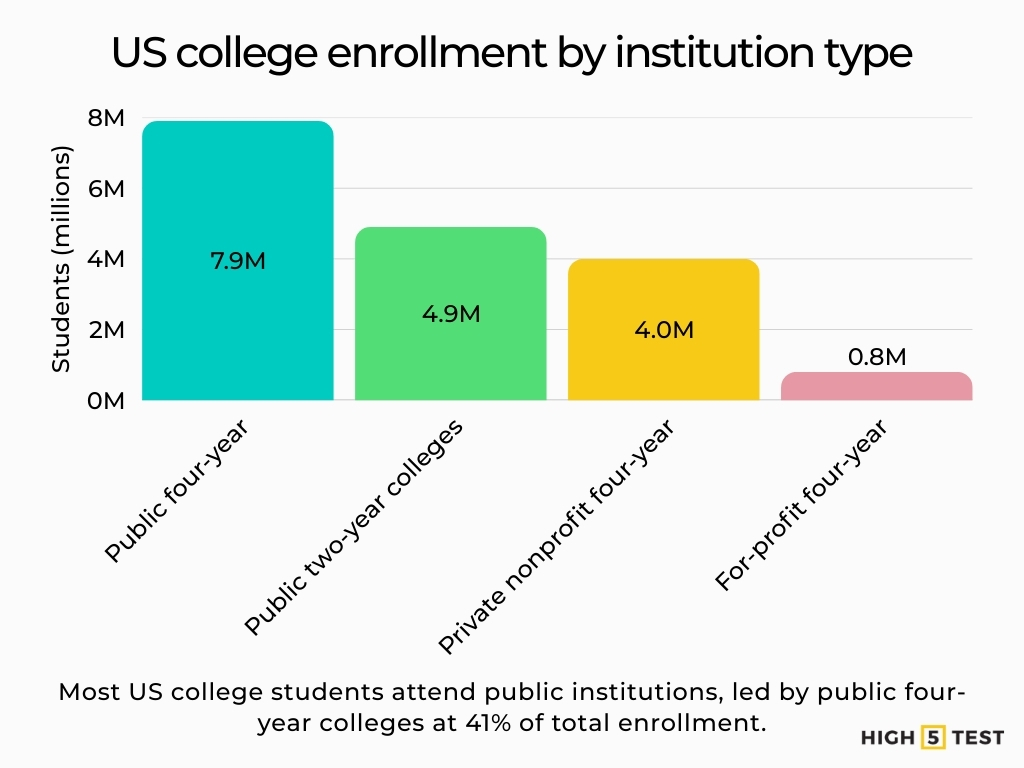
- Public four-year universities enroll about 7.9 million students (about 41% of the total 19.4 million enrollment).
- Public two-year colleges (community colleges and PABs) enroll roughly 4.9 million students (about 25.6% of total enrollment).
- Private nonprofit four-year colleges enroll around 4 million students (about 21%).
- For-profit four-year institutions enroll ~0.8 million students, or roughly 5% of total enrollment.
Public institutions continue to serve the majority of students, especially during periods of economic pressure.
Source: National Student Clearinghouse Research Center
Community colleges as a growth engine
Community colleges and primarily associate-degree-granting baccalaureate (PAB) institutions are central to the current rebound:
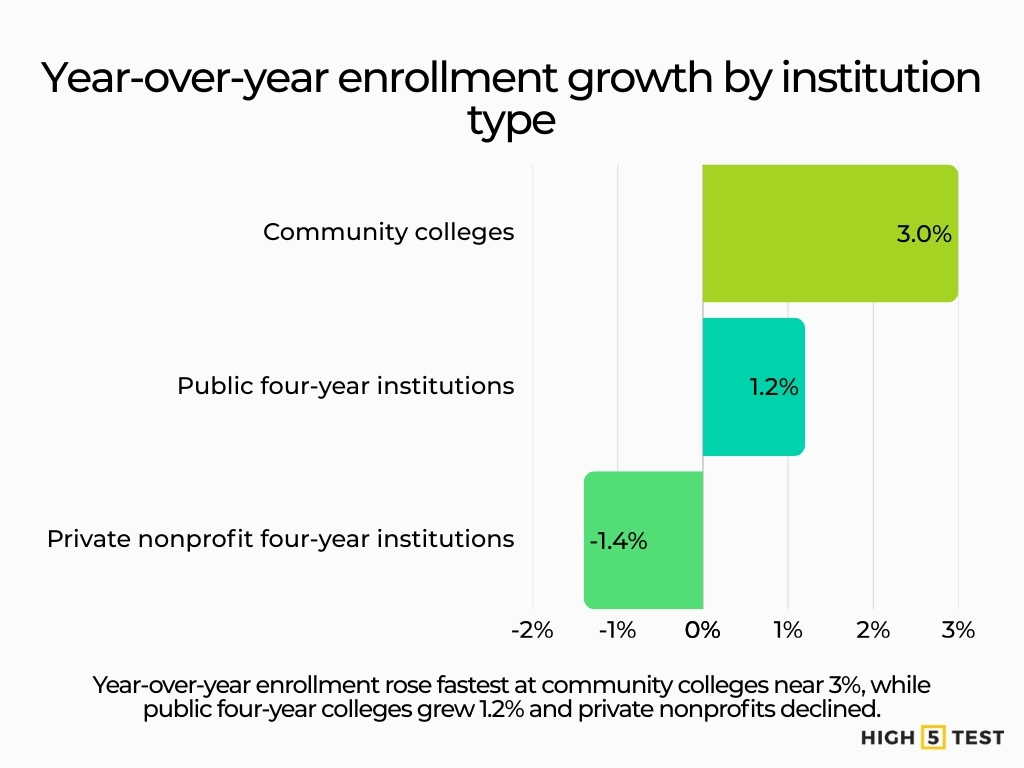
Community colleges are driving much of the current enrollment increase. Enrollment rose nearly 3% year over year, compared with 1.2% growth at public four-year institutions and declines at private nonprofit colleges.
Freshman enrollment held steady with 2.5 million students, but community college freshmen increased 0.5%, with freshmen at two-year/PAB institutions up 0.6%, depending on the sub-sector.
Source: National Student Clearinghouse Research Center
These patterns suggest that lower-cost, flexible two-year options are disproportionately driving the recovery, particularly for first-generation and lower-income students.
Data on enrollment by demographics
Gender patterns
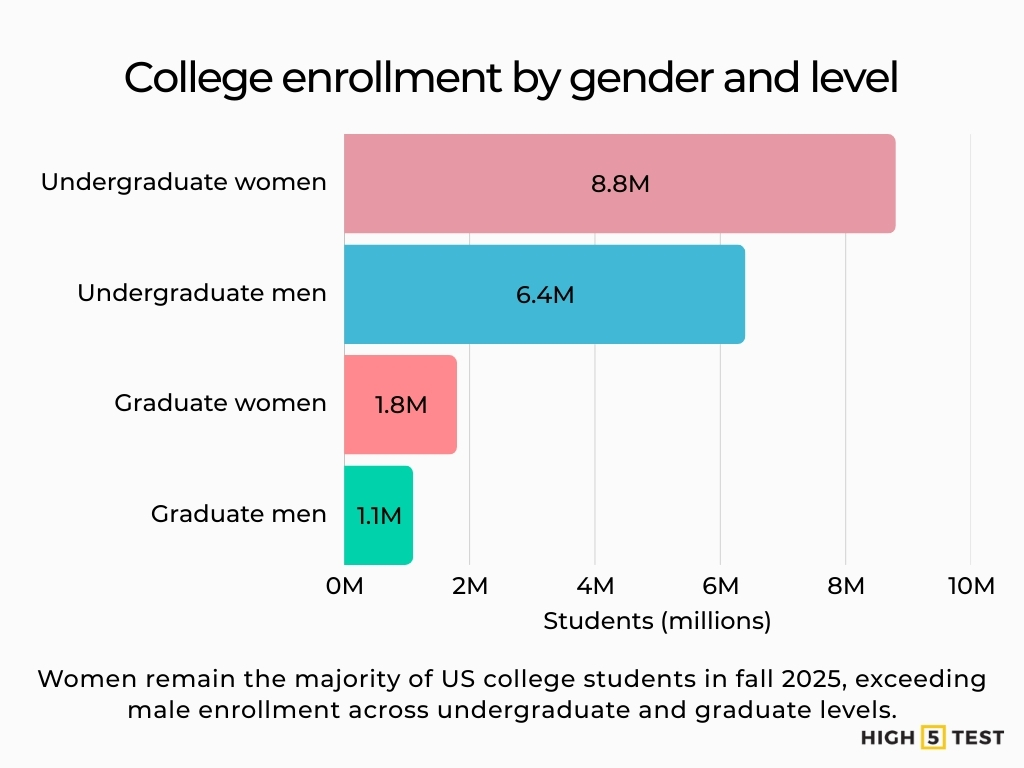
Women continue to make up the majority of college students. In fall 2025, undergraduate enrollment included 8.8 million women and 6.4 million men. Graduate enrollment included 1.8 million women and 1.1 million men. Women account for roughly 55-58% of total enrollment.
Source: National Student Clearinghouse Research Center
A longer-time-series analysis shows that 57.9% of all postsecondary students in fall 2022 were female, continuing a trend in which women have comprised the majority of US college students since the late 1970s.
Source: Education Data Initiative
Race and ethnicity
Students of color accounted for 45.23% of all postsecondary enrollment in fall 2022, up from 15.35% in 1976—an absolute increase of 29.87 percentage points.
Source: Education Data Initiative
In fall 2025, the number of Hispanic/Latino students was 3.1 million, and Black or African American students totaled 1.9 million.
Source: National Student Clearinghouse Research Center
White or Caucasian students comprised 39.6% of college enrollment in 2025, while native Americans represented about 0.67% of all enrolled students.
Source: Best Colleges
US colleges are serving a more diverse student population, especially at public institutions.
Age distribution
Traditional college-age students remain the largest group, but older learners make up a sizable share.
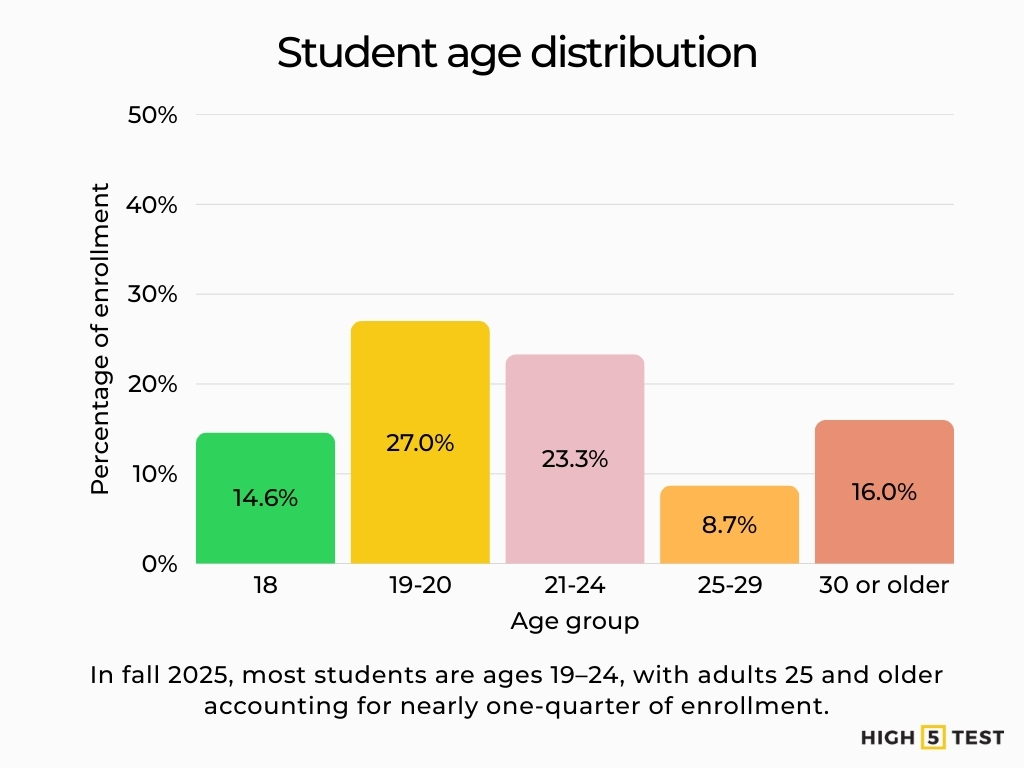
For fall 2025, 23.3% of students are age 21-24, with 14.6% aged 18, and 27% aged 19-20. Adults 25–29 account for 8.7%, and students 30 or older represent 16% of total enrollment.
Source: National Student Clearinghouse Research Center
Another report that in 2022, about 39% of all 18- to 24-year-olds were enrolled in college, and 42.8% of Americans age 25 to 39 held a bachelor’s degree or higher, highlighting both continuing demand and the importance of adult education.
Source: National Center for Education Statistics, Census Bureau
About 17% of undergraduates are over age 30, confirming a sizable non-traditional learner segment.
Source: Best Colleges
Popular majors and programs
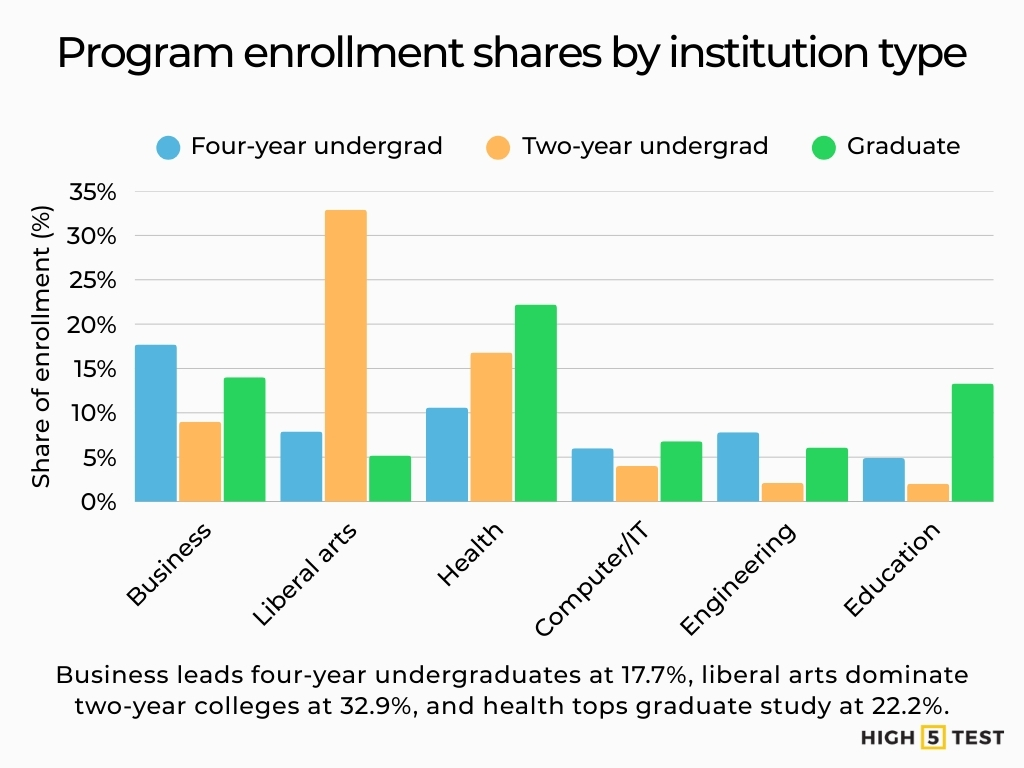
In fall 2025, 17.7% of undergraduates at four-year institutions were business majors, making business the single most common bachelor’s program nationally.
Other major bachelor’s fields at four-year institutions included liberal arts and sciences (7.9%), health professions (10.6%), computer science and technology (6.0%), and engineering (7.8%) of total undergraduates.
At two-year colleges in fall 2025, 32.9% of undergraduates chose liberal arts and sciences, while healthcare (16.8%) and business (9.0%) were also prominent.
Among graduate students in fall 2025, 22.2% pursued advanced healthcare degrees, with business (14.0%), education (13.3%), and computer and information technology (6.8%) representing other major shares of graduate enrollment.
Source: National Student Clearinghouse Research Center
Taken together, these numbers show continued strength in business and health programs, rapid growth in computing-related fields, and a concentration of liberal-arts programs at community colleges and regional publics. Career-oriented programs continue to attract the largest share of students across degree levels.
Statistics on distance and hybrid education growth
Online education remains a major part of higher education.
Total US higher-ed enrollment increased from 18.65 million in fall 2022 to 19.13 million in fall 2023 (+2.6%), while exclusive distance-education (fully online) enrollment rose from 4.97 million to 5.05 million (+1.6%).
Over the same period, “some distance education” enrollment (students mixing online and on-campus courses) grew from 5.17 million to 5.33 million (+3.1%), and enrollment with no distance-education courses increased from 8.52 million to 8.75 million (+2.7%).
Source: On EdTech
Nearly 5 million students now attend classes fully online, which equates to roughly a quarter of all US college students.
Source: Best Colleges
This confirms that online and hybrid models are not a temporary pandemic fix; they are now structural features of US higher education.
Data on regional and state-level patterns (high-level)
Four-year public undergraduate enrollment changed unevenly by state between 2019 and 2023, with some states seeing double-digit percentage declines and others modest growth.
Source: CollegeBoard
Postsecondary enrollment gains are widespread, but the magnitude varies, with some regions (especially states with growing populations in the South and West) showing stronger rebounds than regions with shrinking high-school graduate cohorts in the Northeast and Midwest.
Statistics on financial influences on enrollment
Affordability, grants, and borrowing are tightly linked to who enrolls and persists.
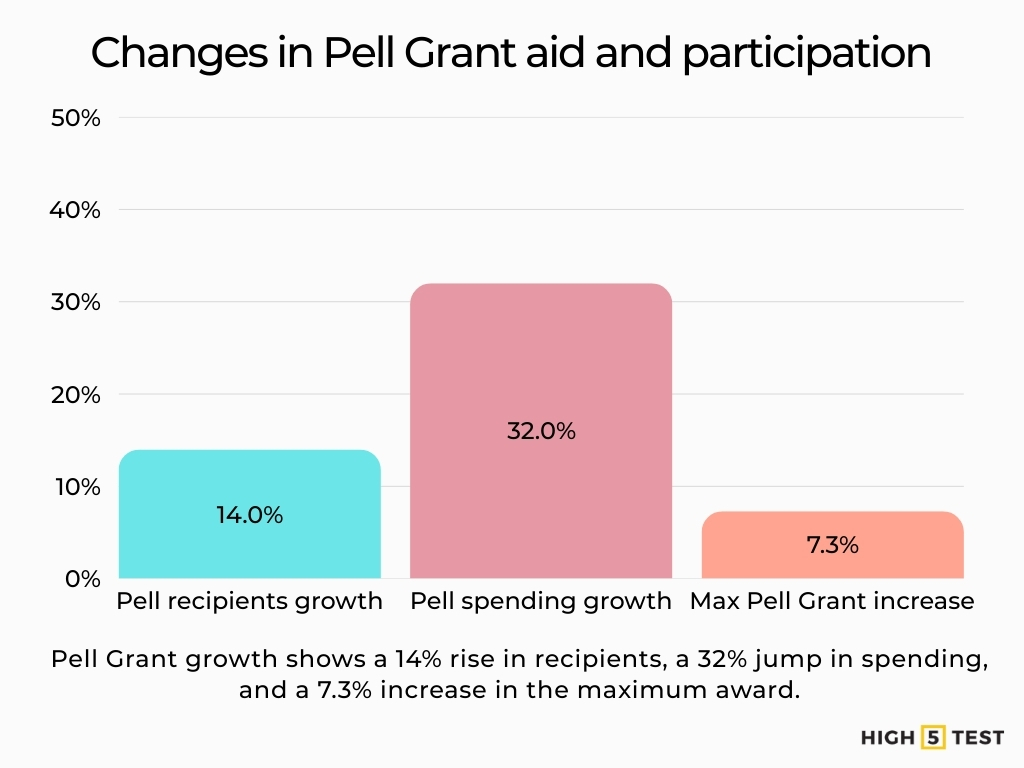
Financial aid expansion has supported enrollment growth. Pell Grant recipients increased 14% between 2024 and 2025, and inflation-adjusted Pell spending rose 32% (from $29.2 to $38.6 billion).
The maximum Pell Grant increased from $6,895 in 2022–23 to $7,395 in 2023–24 (+7.3%) and remained $7,395 in 2024–25, providing more up-front aid but still covering a shrinking share of the total cost of attendance.
At the same time, total annual federal loans for undergraduates fell 43% over a decade, from $81.5 billion in 2014–15 to $46.3 billion in 2024–25 (in 2024 dollars), reflecting shifts in borrowing behavior and enrollment levels.
Source: CollegeBoard
In 2019, about 66.2% of recent high-school graduates enrolled in college, but by 2024 that share had dropped to 62.8%. At the same time, survey data show college-going rates among recent high school graduates have fallen, with cost cited as the top barrier (53%).
Source: Bureau of Labor Statistics, Bureau of Labor Statistics, Ellucian
Taken together, the evidence suggests aid expansion helps, but affordability remains a major concern for many students.
International student enrollment statistics
International students are once again at or above all-time-high levels, although growth is uneven across campuses and states.
International student enrollment in US higher education reached 1,177,766 students in 2024/25, up from 1,126,690 in 2023/24 (+5%), representing about 6% of total US college enrollment.
Source: Open Doors
The 2023/24 academic year had already set a record with roughly 1.1 million international students, and Optional Practical Training (OPT) participation reached 242,782 students (+22% YoY), underscoring the link between US study and post-study work pathways.
Source: Open Doors
International students contributed $42.9 billion and supported 355,736 jobs to the U.S. economy during the 2024-2025 academic year, highlighting their outsized financial impact.
Source: NAFSA
Despite these gains, more recent reports point to localized declines in new international enrollments (–17% in some data sets for 2025/26) at certain institutions, especially in regions sensitive to immigration and visa policy shifts, even as the national headcount remains high.
Source: NAFSA
Future enrollment outlook
Spring 2025 data shows three consecutive terms of year-over-year growth, with +4.5% in fall 2024 and +3.2% in spring 2025, suggesting that the post-pandemic trough is behind us but that recovery is still modest compared with 2010 peaks.
Source: Best Colleges
Projections show that undergraduate enrollment will grow about 9% from 2021 to 2031, with two-year institutions potentially outpacing four-year institutions (12% vs. 7% growth) and part-time study growing slightly faster than full-time (10% vs. 8%).
Source: National Center for Education Statistics
Another forecast shows flat or declining numbers of high-school graduates in many states over the next decade, effectively an “enrollment cliff,” which will pressure institutions to recruit more adult, part-time, online, and international students to maintain headcounts.
Source: Western Interstate Commission for Higher Education (WICHE)
The most likely scenario is slow net growth, with big winners in sectors that offer low cost, flexibility, and clear career pathways (community colleges, online programs, career-focused majors) and continued challenges for small, high-cost institutions in regions with shrinking youth populations.
Conclusion
College enrollment in the United States is growing again after years of decline, but patterns have shifted. Community colleges, online programs, and career-focused fields are leading gains. Cost pressures, demographic changes, and competition continue to shape outcomes. Institutions that align offerings with affordability, flexibility, and workforce demand are best positioned for the next decade.