Productivity, measured as output per hour or per worker, remains a key indicator of business performance, economic progress, and employee well-being. With remote and hybrid work increasingly standard, tracking shifts in productivity has become essential.
This article reviews U.S. employee productivity trends through 2024 and into early 2025. It compares remote, hybrid, and on-site work models, outlines industry benchmarks, and examines how factors such as age, gender, and job function impact output. It also identifies common causes of low productivity, supported by relevant data, and provides practical strategies for leaders aiming to improve results.
10 most interesting employee productivity statistics in the US
- Productivity rose 3.3% in Q2 2025 (annualized) – output increased by 4.4%, while hours worked increased by 1.1%.
- From Q2 2024 to Q2 2025, productivity increased 1.5% year-over-year
- In manufacturing in Q2 2025, output rose even though hours fell by 0.1%
- Among workers using generative AI, average time savings = 5.4% of work hours; across all workers (including non-users), that’s ~1.4%
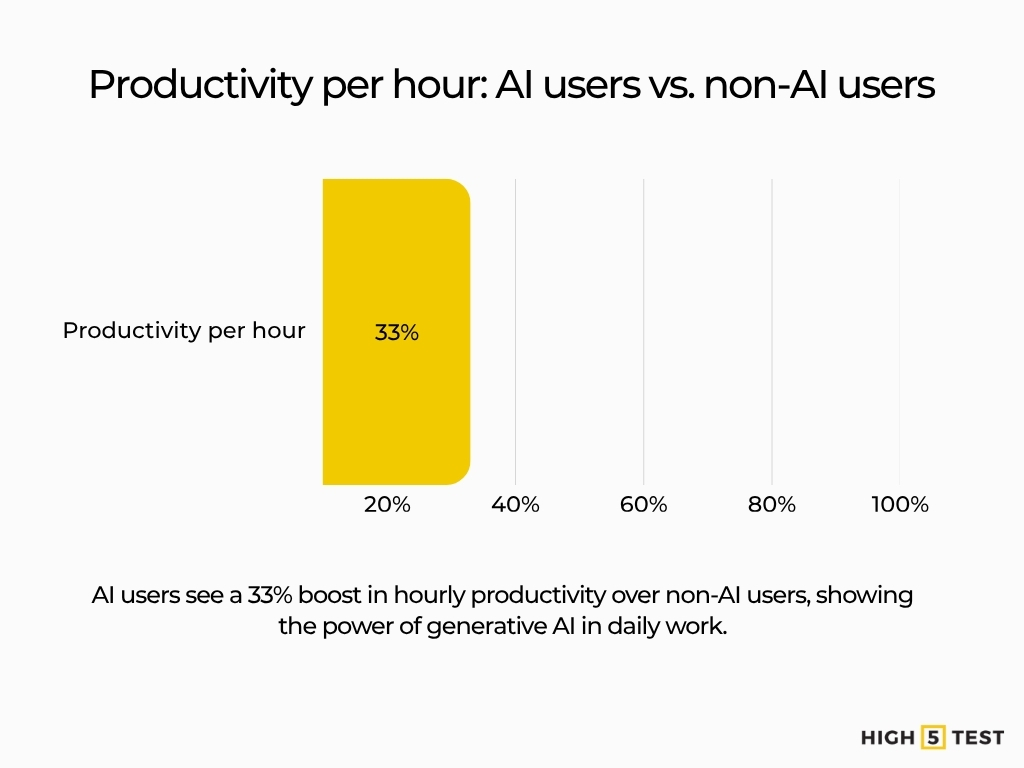
- Workers are on average 33% more productive in each hour they use generative AI
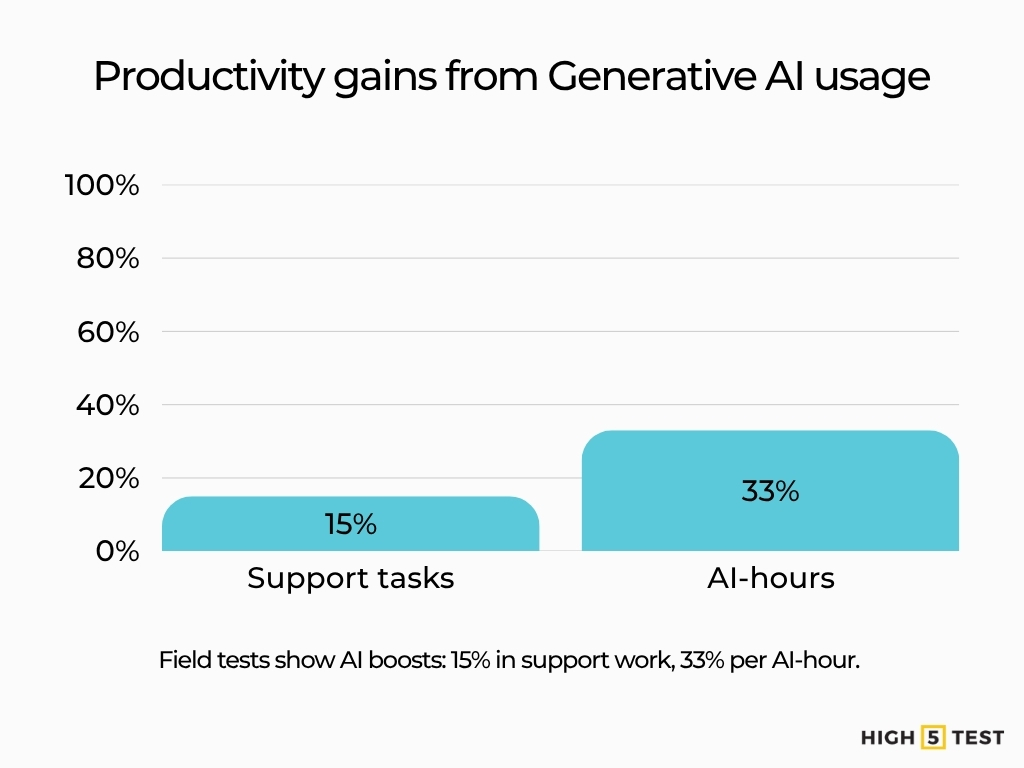
- Issue resolution per hour rose 15% with AI assistance (field experiment)
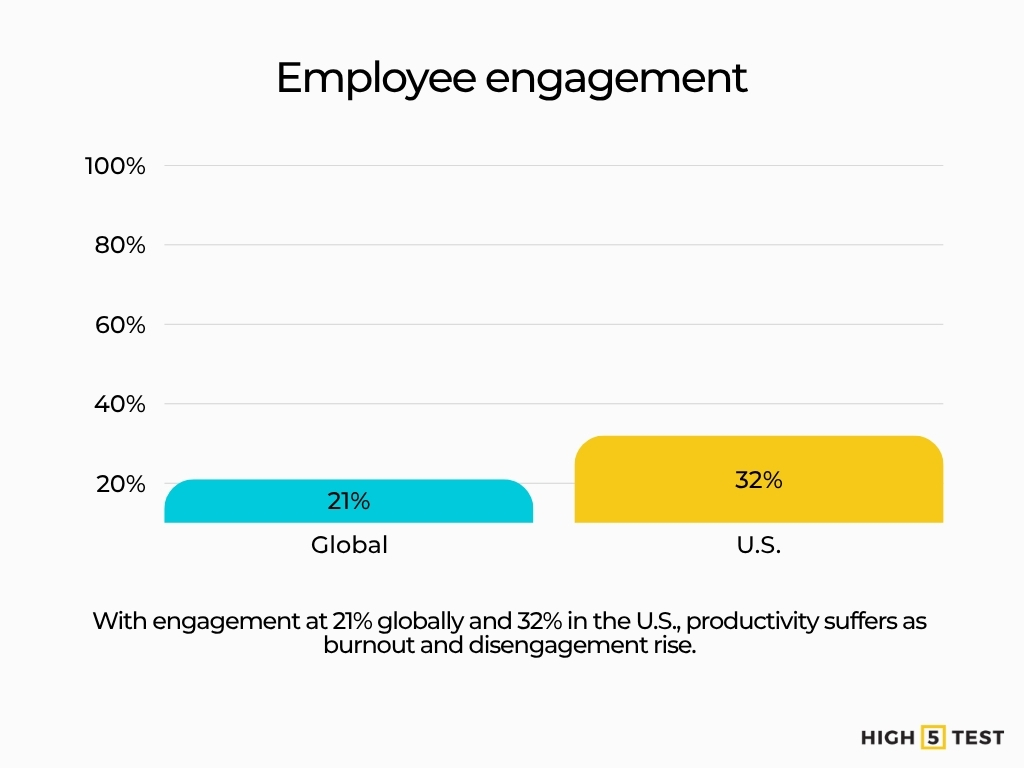
- Global employee engagement dropped to 21%; in the U.S., it fell to 32%
- 66% of American employees report experiencing burnout in 2025
- Younger workers report much higher burnout: 81% of 18–24 year olds, 83% of 25–34 year olds vs. 49% of those 55+
- Firms that provide training to engaged employees are ~17% more productive
Employee productivity statistics in the U.S. (2024-2025)
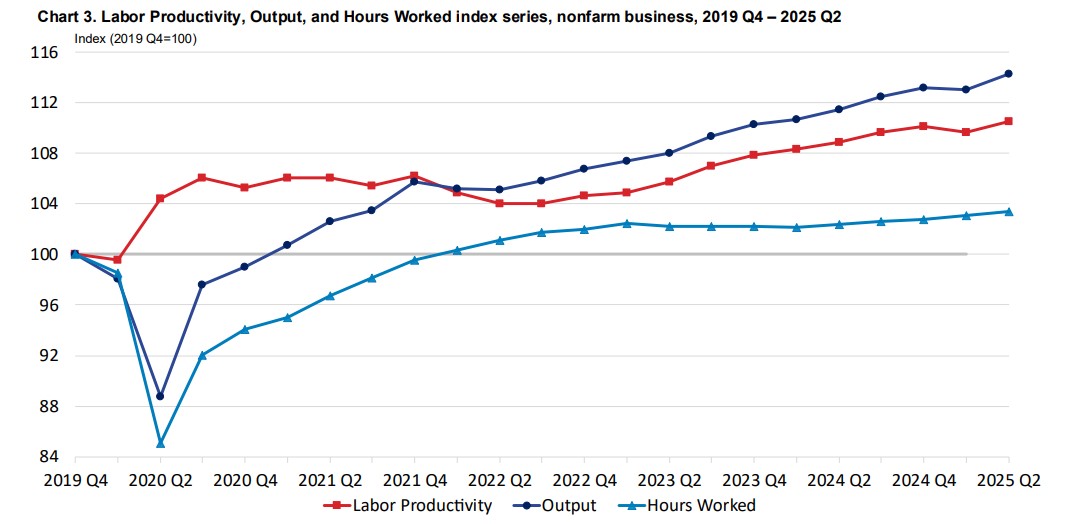
Labor productivity growth and recent performance
As noted, labor productivity rose 3.3% in Q2 2025 (annualized), with output increasing by 4.4% and hours +1.1%.
From Q2 2024 to Q2 2025, productivity rose 1.5% (year-over-year).
Over the business cycle starting in Q4 2019, productivity has grown at ~1.8% annualized, reflecting output growth of ~2.4% and hours growth of ~0.6%.
Source: U.S. Bureau of Labor Statistics
In manufacturing, Q2 2025 productivity rose 2.5%, with durable manufacturing up 3.2% and nondurable manufacturing up 1.9%.
On a year-over-year basis, manufacturing sector productivity increased by ~1.6%.
This Q2 result is a strong rebound, but volatility remains. Sustaining this will depend on how much of the gain comes from structural rather than cyclical factors.
Source: U.S. Bureau of Labor Statistics
Unit labor costs, real compensation, and inflation
In Q2 2025, unit labor costs rose 1.0% (annualized) in nonfarm business.
Hourly compensation increased by 4.3%, while productivity rose by 3.3%, exerting upward pressure on costs. Real hourly compensation (after price adjustment) increased 2.6% in Q2.
Over the past four quarters, unit labor costs rose ~2.5%.
The data suggests that while productivity gains helped offset some of the rise in compensation, labor costs continue to add modest inflationary pressure. The increase in real wages also signals stronger consumer purchasing power, which could support demand but complicate inflation control efforts.
Source: U.S. Bureau of Labor Statistics
Decomposing output vs. hours worked
Since output grew 4.4% while hours rose 1.1%, the incremental productivity is driven by doing more per hour.
In manufacturing, hours actually fell by 0.1% even as output rose.
The data shows that productivity gains are coming from increased efficiency rather than longer work hours. In manufacturing, the contrast is even sharper—output grew despite a slight drop in hours, reinforcing the trend toward higher output with fewer inputs.
Source: U.S. Bureau of Labor Statistics
Sectoral patterns and differences
Durable manufacturing showed stronger gains (3.2%) than nondurable (1.9%) in Q2.
Source: U.S. Bureau of Labor Statistics
In 2024, wholesale trade rebounded with 1.8% productivity growth, and retail trade saw 4.6% productivity growth. These differences highlight how sector-specific dynamics influence overall productivity trends.
Source: U.S. Bureau of Labor Statistics
Statistics on employee-level productivity
Typical “productive hours” and time use patterns
In November 2024, among workers who used generative AI, the average time savings was 5.4% of work hours. When averaged across all workers (including non-users), that corresponds to ~1.4% of total hours saved.
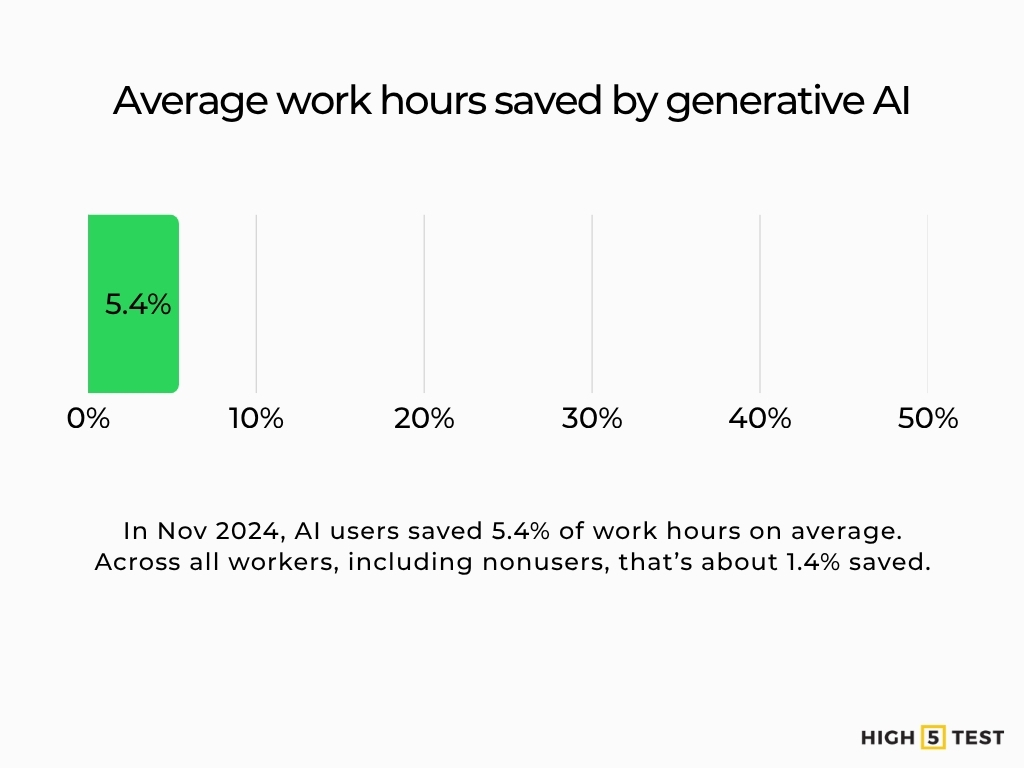
Source: Federal Reserve Bank of St. Louis
Overall, 20.5% of generative AI users reported saving four or more hours in one week. Among those who used AI daily, 33.5% reported saving four hours or more. The study also shows a strong positive correlation between time spent using generative AI and the proportional time saved.
Source: Federal Reserve Bank of St. Louis
Caution/Nuance: The survey relies on self-reported counterfactuals (“how much more time would you have needed’), so actual gains may vary. The authors note that factors such as on-the-job leisure, task substitution, and measurement distortion may influence the extent to which these gains are reflected in overall statistics.
Engagement, quiet quitting, and discretionary effort
Global employee engagement dropped to 21%, while U.S. employee engagement fell to 32%. Though harder to quantify, disengagement, low discretionary effort, burnout, and attrition are recognized in HR research as negative modifiers of productivity.
Well-being, burnout, and mental health
In 2025, 66% of American employees report experiencing some form of burnout, driven by:
- Feeling overwhelmed by ample tasks and limited time – 24%
- Lacking sufficient resources or the appropriate tools to perform their job effectively – 24%
- Perceiving a weak economy that affects their well-being at work – 20%
- Overburdened by excessive work stemming from labor shortages in their industry – 19%
- They’re worried about how AI will impact their role – 13%
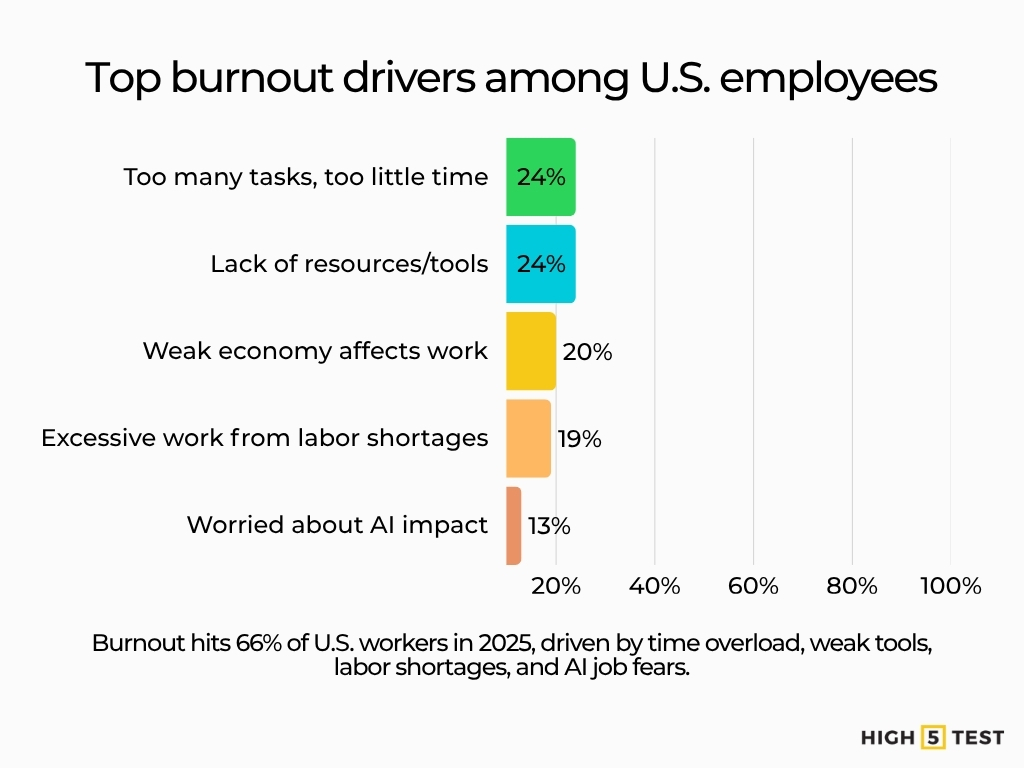
Source: Moodle
Younger generations experience much higher burnout rates, with 81% of 18 to 24-year-olds and 83% of 25 to 34-year-olds reporting burnout, versus only 49% of those aged 55 and above.
These patterns indicate an increasing demand for focused strategies that tackle both structural issues and employee well-being.
Source: Moodle
Remote/hybrid vs. in-office
A study of 61 U.S. industries finds that increases in remote share are positively associated with TFP growth, controlling for pre-pandemic trends. Their model estimates that a one percentage-point increase in remote workers maps to 0.08 percentage points of additional TFP growth. This association is 0.09 in the 2019–22 period.
Source: U.S. Bureau of Labor Statistics
Workers are on average 33% more productive in each hour they use generative AI.
Source: Federal Reserve Bank of St. Louis
AI, automation, and tool adoption impacts
Issue resolution per hour increased by 15% with AI assistance. (Field experiment)
Source: Federal Reserve Bank of St. Louis
Survey data show that using generative AI correlates with higher per-hour productivity, resulting in 33% more productivity per AI hour.
Source: Federal Reserve Bank of St. Louis
It is suggested that between 1% and 5% of all work hours are currently assisted by generative AI, yielding time savings that translate into productivity gains of ~1.4% of total hours.
Source: Federal Reserve Bank of St. Louis
Given current usage levels, generative AI could plausibly raise labor productivity by between 0.1% and 0.9% in the short run.
Source: Federal Reserve Bank of St. Louis
Field experiments also reveal behavioral shifts: knowledge workers using AI spent 3.6 fewer hours per week on email (approximately 31% less) and completed documents faster, although meeting time did not change significantly
Source: arXiv
An experiment found a 17% improvement in answer quality and a 34% faster task completion time for document-based tasks using AI.
Source: arXiv
Data on drivers and barriers of employee productivity growth
Technology and digital tooling
Among employed U.S. respondents, 23% used generative AI at least once in the previous week, and between 1% and 5% of all work hours are currently AI-assisted.
Source: Federal Reserve Bank of St. Louis
The same study estimates time savings equivalent to 1.4% of total work hours from AI use. However, realizing these gains at scale is constrained by adoption lags, integration complexity, user training, and organizational inertia, as the authors discuss.
Source: Federal Reserve Bank of St. Louis
Some researchers caution that the full productivity impact of AI may lag measurement periods because workers might take time savings as leisure (not captured in output) or misclassify tasks.
Source: Federal Reserve Bank of St. Louis
Skills, training, and reskilling
Firms that provide training to engaged employees are ~17% more productive.
Source: Gallup
U.S. industry reports indicate that training investments in 2024 declined by 3.7% to $98 billion, a modest decrease.
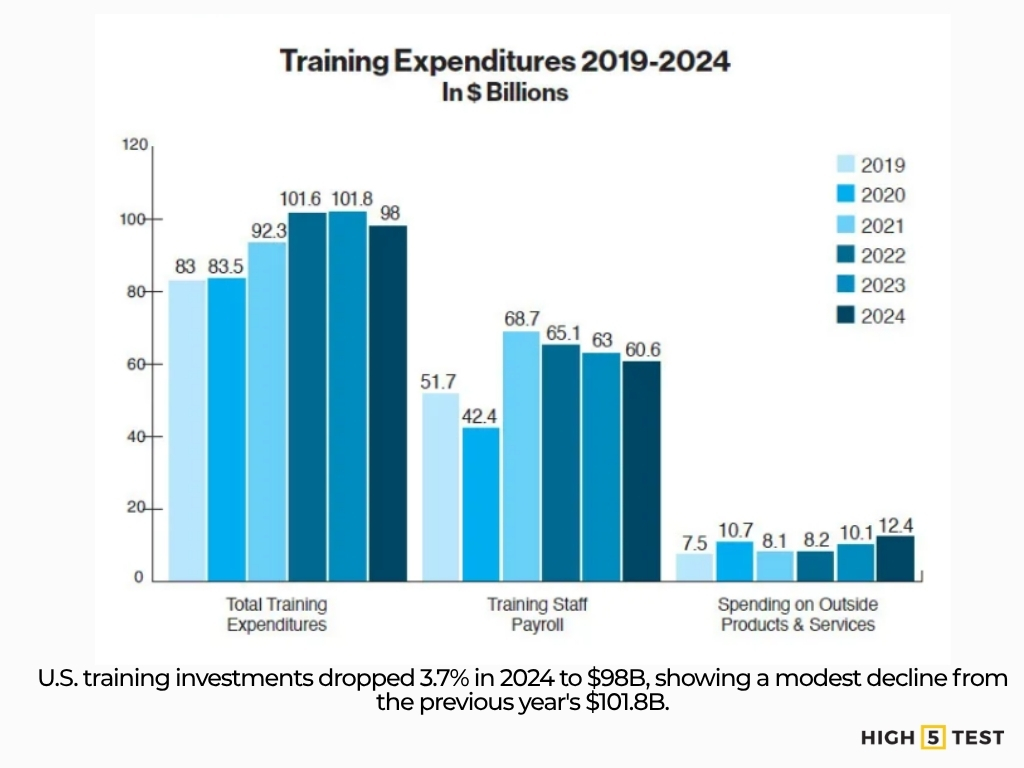
Source: Training Magazine
Employee development participation remains low. Less than half (45%) of U.S. employees participated in any education or training for their current job. Time away from job responsibilities, budget constraints, and lack of learning opportunities are frequently cited as key barriers.
Source: Gallup
Organizational culture, practices, and work design
Process friction, lack of accountability, and unnecessary complexity are major “drag factors” preventing productivity gains.
Source: McKinsey
A study finds that satisfaction with workspace design and support mechanisms correlates positively with perceived productivity.
Source: ScienceDirect
Another study on organizational capacity and well-being suggests that firms that invest in supporting structures and employees’ capacity tend to see better productivity outcomes.
Source: National Bureau of Economic Research
Infrastructure, remote enablement, and environment
Increased remote share correlates with higher TFP and enhances productivity by ~0.08 ppt per additional remote percentage point.
Source: U.S. Bureau of Labor Statistics
The generative AI survey suggests that current AI usage spans between 1% and 5% of work hours; this indicates that infrastructural readiness (cloud, connectivity, tooling) is already enabling modest adoption.
Source: Federal Reserve Bank of St. Louis
Macro and external constraints
Estimates place the baseline productivity gains from generative AI in the 0.1% to 0.9% range, given current usage. Organizational, regulatory, capital cost, and adoption lags remain significant headwinds.
Source: Federal Reserve Bank of St. Louis
A study observed that not all behaviors shift readily: coordination costs and meeting structure are more resistant to change.
Source: arXiv
Statistics on employee benchmarking and comparisons
Cross-country productivity performance often hinges less on new technology per se and more on the speed of diffusion, business model adaptation, and institutional capability.
Source: Behavioural Insights Team
The AI adoption curve observed in the U.S. (23% weekly usage) is as fast or faster than the early adoption phase of PCs or the internet in historical comparisons.
Source: Federal Reserve Bank of St. Louis
In controlled and field experiments, generative AI usage has delivered 15% throughput improvements (support tasks) and 33% per-hour productivity gains in AI-hours. These serve as benchmarks against which to measure organizational adoption.
Source: Federal Reserve Bank of St. Louis
AI and employee productivity forecasts
Based on current usage, generative AI could plausibly raise labor productivity by 0.1% to 0.9% in the short run.
Source: Federal Reserve Bank of St. Louis
With scaling, AI could assist in 1%-5% of work hours and yield 1.4% time savings if fully utilized.
Source: Federal Reserve Bank of St. Louis
In scenario modeling, you might posit:
| Scenario | Assumptions | Estimated Productivity Growth |
| Conservative | Slow adoption, modest scaling | +1.5% – 2.0% annually |
| Moderate | Broad moderate AI + digital diffusion | +2.0% – 2.8% |
| Aggressive | Rapid AI/tool adoption, reorganization | +2.8% – 3.5%+ |
Risks: Over-reliance on AI, validation overhead, mismeasurement (workers converting time savings to non-work), inequality between firms that adopt vs. laggards, coordination failures, macro shocks.
Conclusion
The 3.3% productivity rebound in Q2 2025 is an encouraging signal, but sustaining momentum will require more than a cyclical lift. Structural transformation is essential. Data from personality assessments for teams, field experiments, AI usage surveys, and sectoral trends indicate significant upside potential.
Yet, challenges remain: adoption lags, measurement limitations, and organizational inertia continue to temper impact. The real test for 2025 is not technological promise but operational execution – which firms can move beyond pilots and translate localized gains into scalable, systemic productivity improvements?