Employee training and development in the U.S. is at a crossroads. After two years of record-high investment topping $100 billion, 2024 brought a slight pullback in budgets, but not in urgency. Engagement levels have sunk to a 10-year low, turnover remains a costly drain, and managers continue to be underprepared for leadership roles. At the same time, rapid advances in AI are reshaping job requirements, with most organizations scaling up technical and practical AI training to keep pace.
Companies are reallocating spend toward external content and career-driven learning, signaling a shift from cost containment to strategic investment in skills, leadership, and retention. The data shows a clear throughline: organizations that prioritize career development, onboarding, and team effectiveness not only perform better but are more confident in their ability to keep talent. The following research highlights the most striking statistics and trends shaping training and employee development in 2024–2025.
10 most interesting employee training statistics for the US (2024/2025)
- Employee engagement crisis – Only 31% of U.S. employees were engaged in 2024, the lowest level in a decade.
- Turnover is brutally expensive – Replacing an employee costs employers on average 33.3% of base salary, making retention strategies like training and team building directly tied to ROI.
- Training market pullback after historic highs – Corporate training spend fell from $101.8B in 2023 to $98B in 2024 (–3.7%), even as external content and service spend surged +23% to $12.4B.
- Unit costs are rising fast – Direct learning cost per hour hit $165 in 2024, up 34% YoY, despite overall budget tightening.
- Leadership training gap – Almost 60% of first-time managers never received management training, and less than half of managers overall are formally trained—yet 70% of team engagement variance is attributable to the manager.
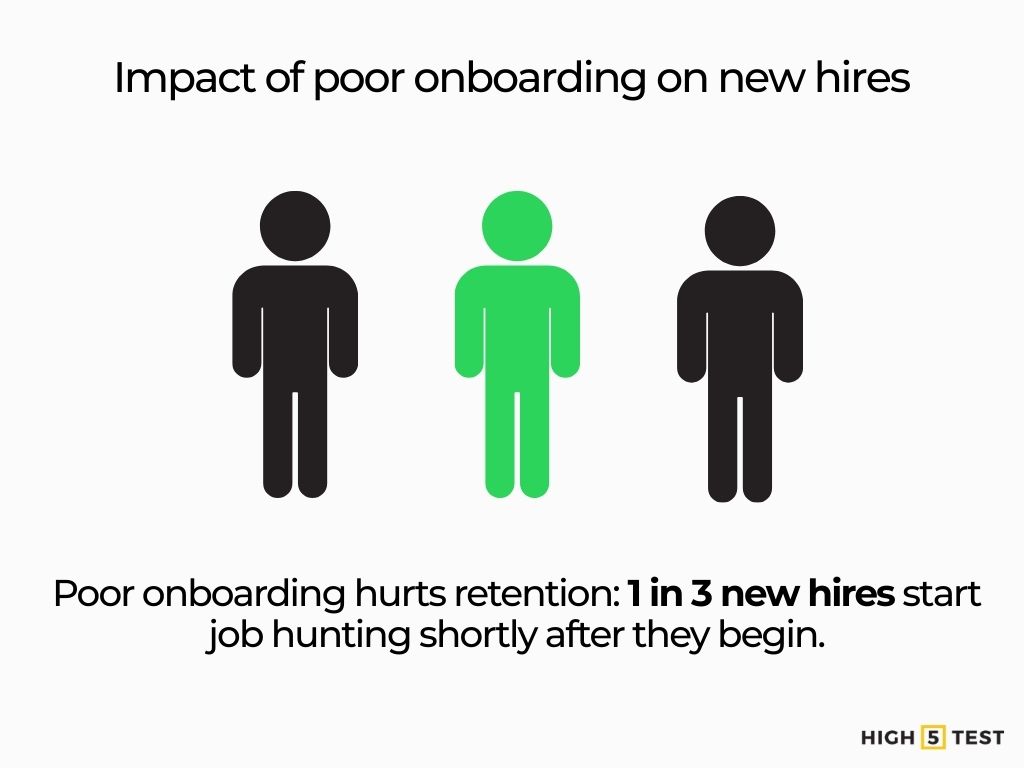
- Onboarding is make-or-break – 1 in 3 new hires start looking for another job soon after joining due to poor onboarding, while structured onboarding accelerates productivity and boosts retention.
- AI adoption is exploding – AI usage in L&D stacks nearly tripled, from 9% in 2023 to 25% in 2024. Additionally, 55% of organizations already provide AI skills training, with over 60% planning to expand it.
- Career development = retention – Career Development was the #1 controllable reason employees left jobs (17.5%) in exit interviews. Organizations strong in career development are 32% more likely to deploy AI training and significantly more confident in profitability, attraction, and retention.
- Generational expectations are shifting – 53% of Gen Z (vs. 37% of older cohorts) say learning helps them explore career paths at their company. Strikingly, only 6% of younger workers list reaching a leadership position as their primary career goal.
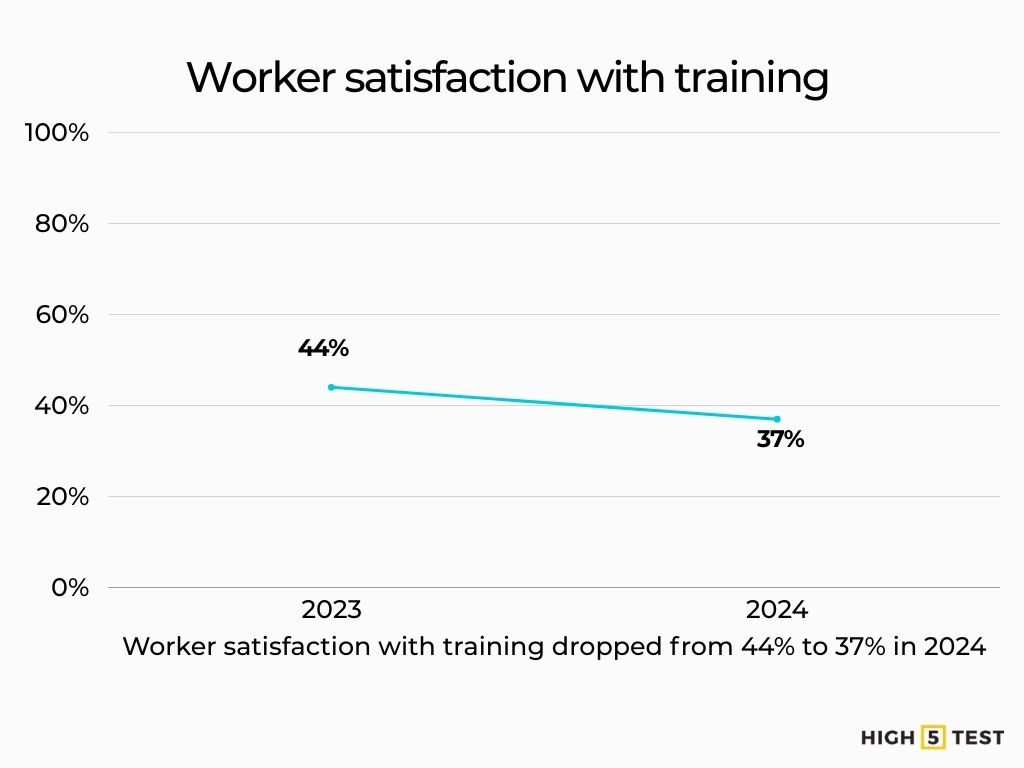
- Training satisfaction slipping – Only 37% of U.S. workers in 2024 reported being highly satisfied with their training and skill-development opportunities, down from 44% in 2023, despite 84% of employees saying that learning gives their work more purpose.
Statistical importance of employee training and development
Engagement headwinds are real. U.S. employee engagement fell to a 10-year low in 2024 (31% engaged), underscoring the need for intentional programs that build team connection, clarity, and collaboration.
Source: Gallup
Team effectiveness hinges on psychological safety. There is strong evidence that creativity, learning, and exploration increase when psychological safety is higher—exactly the outcomes team-building and manager training aim to cultivate.
Source: Harvard Business Review
Career development and retention are linked. Organizations that prioritize career development (“career development champions”) are more confident in their ability to retain qualified talent; 83% say they will maintain or increase investment in career-driven learning this year. These initiatives typically include leadership, collaboration, and cross-functional programs that strengthen team performance.
Source: LinkedIn Business Solutions
Turnover is costly. The rising cost of turnover for U.S. employers is about 33.3% of an employee’s base salary, reinforcing the ROI case for programs that improve team cohesion and manager effectiveness.
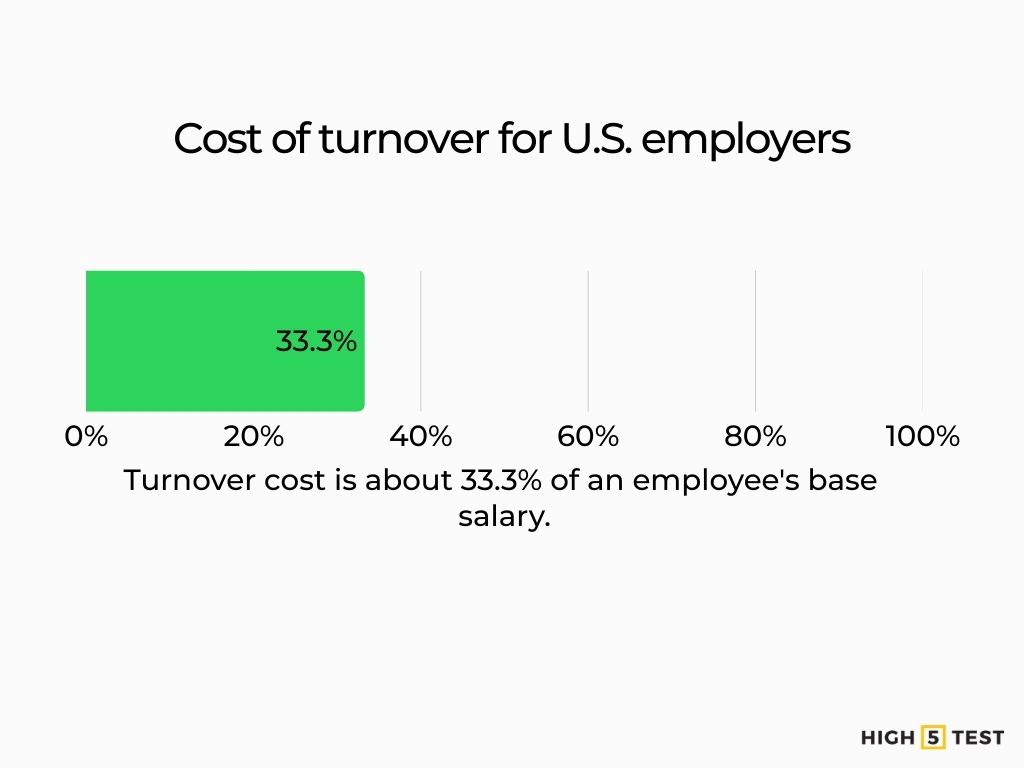
Source: Work Institute
Stats on employee training budget and expenditure trends
Per-employee and unit costs. In 2024, direct learning spend per employee is at $1,254 (down from $1,283 in 2023), and an average $165 cost per learning hour used (up 34% YoY) – evidence of unit-cost pressure even as many budgets hold steady.
Source: Association for Talent Development
2025 budget direction. Looking ahead, 83% of organizations say they will maintain or increase career-driven learning investment in 2025, indicating resilience in strategic training categories (leadership, collaboration, internal mobility) despite cyclical pressure.
Source: LinkedIn Business Solutions
Spend mix is shifting. In 2024, companies decreased total payroll for training staff and “other” costs (travel, facilities, equipment) but increased spend on outside products and services (e.g., content, providers) by 23% to $12.4 billion, signaling more reliance on external solutions.
Source: Training Magazine
Stats on total U.S. corporate training expenditure (annual trend)
2022: $101.6B (first time the market surpassed $100B).
Source: Training Magazine
2023: $101.8B (essentially flat YoY, +0.2%).
Source: Training Magazine
2024: $98.0B (–3.7% YoY), with $60.6B in training payroll (–4%), $12.4B on outside products/services (+23%), and $25.0B in other costs (down from $28.7B).
Source: Training Magazine
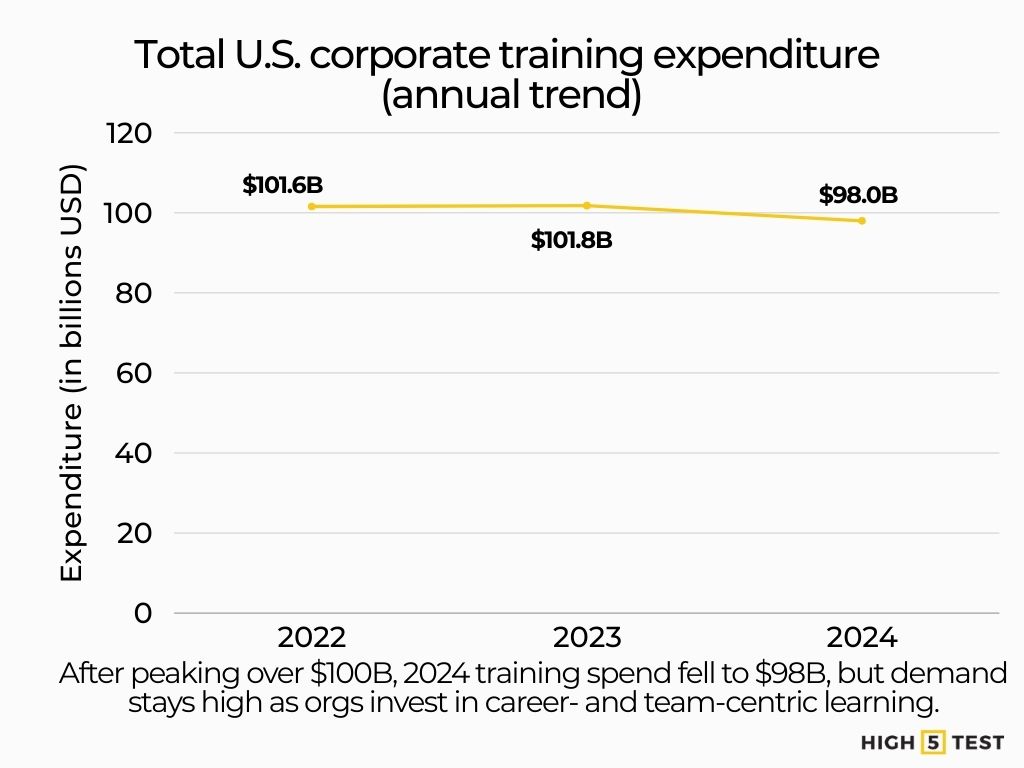
What this means: Even with a 2024 pullback, the market remains near historical highs. Organizations are reallocating toward scalable, externally sourced learning and doubling down on career- and team-centric programs in 2025 to counter engagement and retention risks.
Stats on employee training costs and budgets
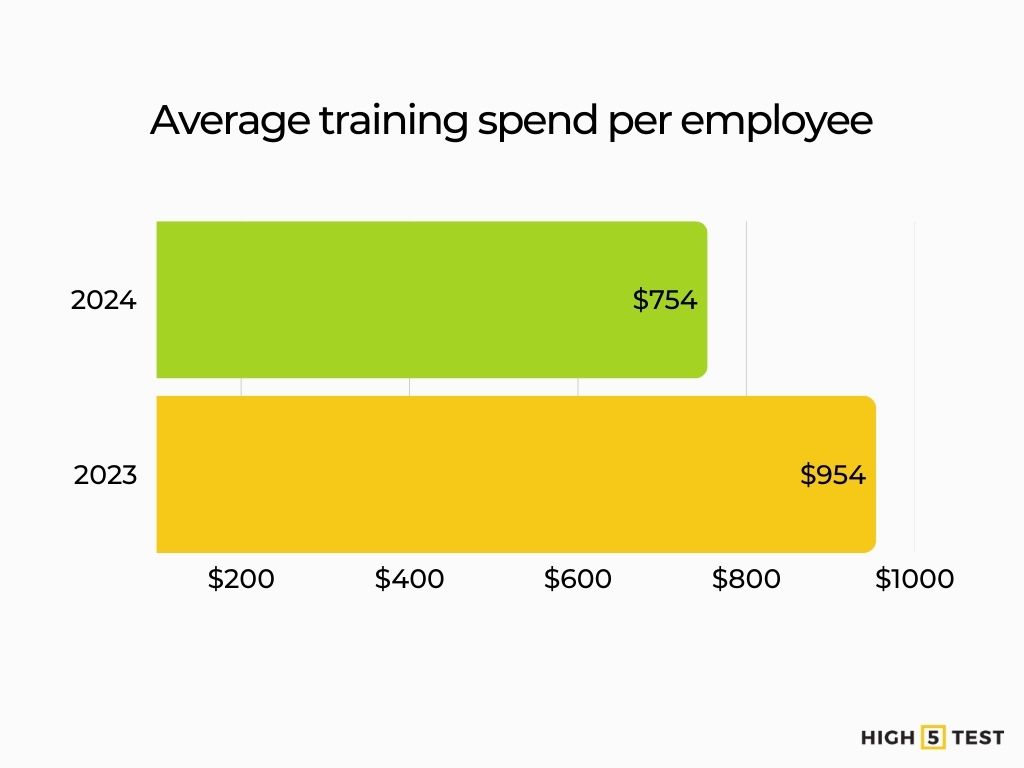
1. Average training cost per employee
According to a recent analysis, U.S. companies spent an average of $774 per learner in 2024, down from $954 in 2023.
Source: Training Magazine
An average direct expenditure of $1,054 per employee, representing a modest decline from previous years.
Source: Association for Talent Development
Summary: The training cost per employee in 2024 ranged between $774 (overall average) and $1,054 (direct spend metric), depending on measurement context.
Training budget by company size
Large companies (10,000+ employees): average annual training spend dropped from $16.1 million in 2023 to $13.3 million in 2024.
Source: Training Magazine
Midsize companies (1,000–9,999 employees): training spend increased from $1.5 million to $1.7 million.
Source: Training Magazine
Small companies (100–999 employees): budgets dropped from $459,177 to $374,207.
Source: Training Magazine
Summary: In 2024, large enterprises scaled back training investment, midsize firms increased, and smaller organizations reduced budgets—reflecting strategic consolidation in training spending priorities.
Training budget by industry
While comprehensive breakdowns are limited for 2024, here’s what’s available:
In 2023, the average training spend per employee by industry:
- Service organizations: $1,512
- Retail and wholesale: $1,299
Source: Training Magazine
Employee training time and delivery modalities
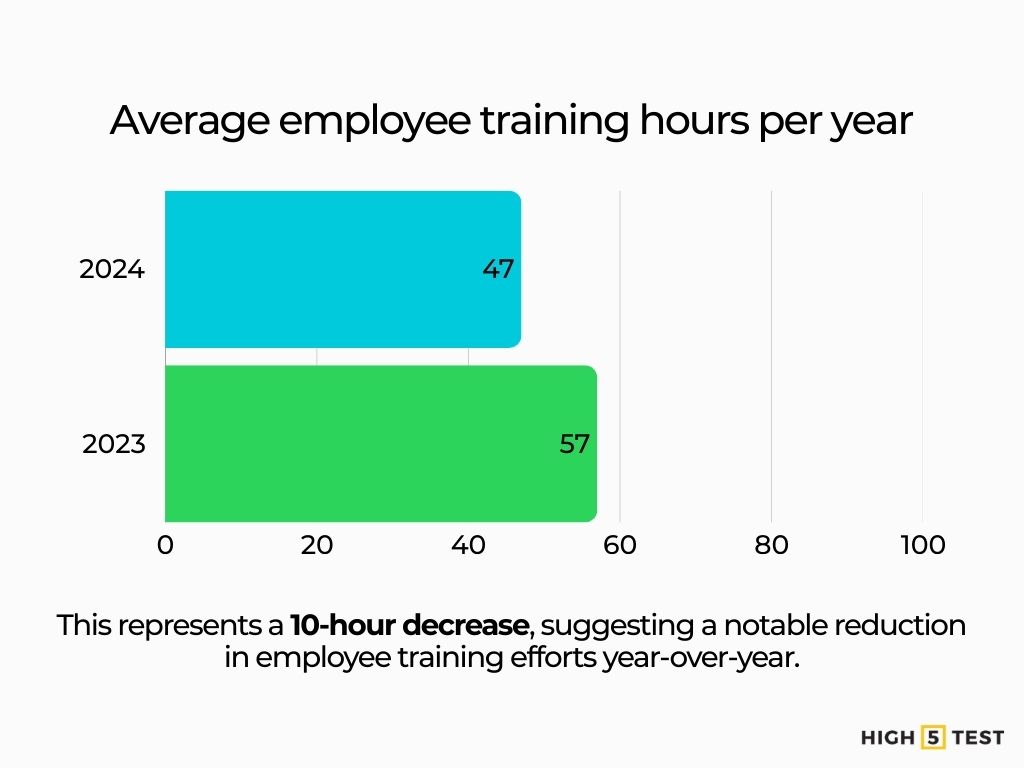
Average training hours per employee (annual)
In 2024, employees received an average of 47 training hours per year, down from 57 hours in 2023, as companies reassess training formats and priorities.
Source: Training Magazine
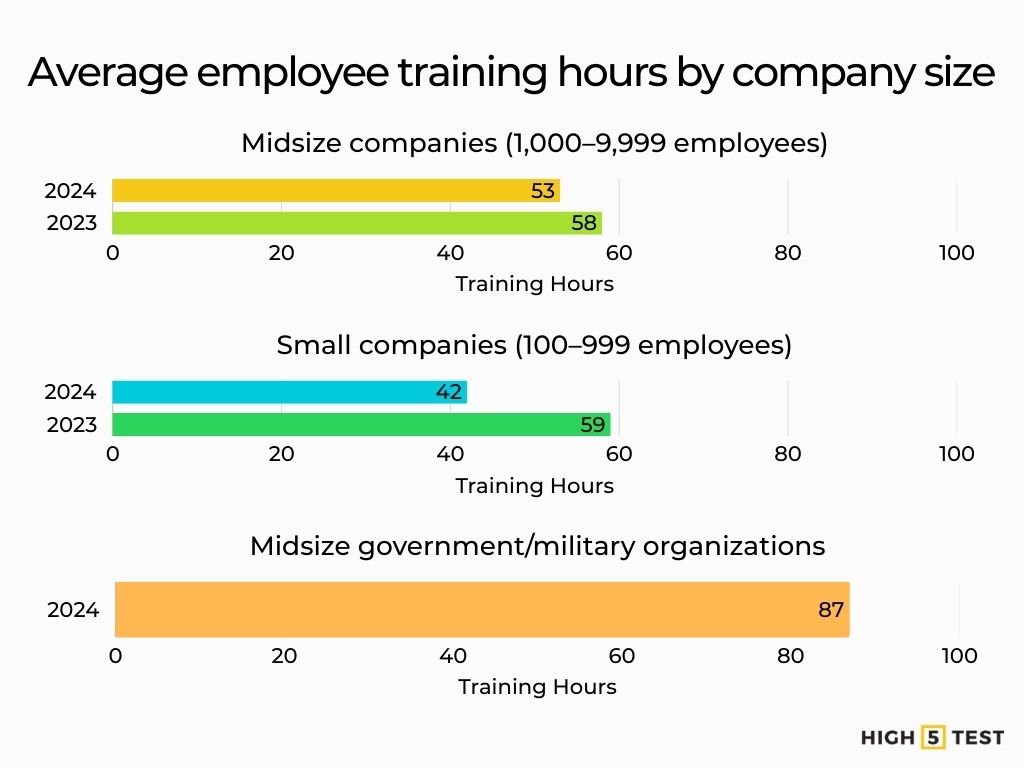
Training hours by company size
Midsize companies (1,000–9,999 employees): 53 hours in 2024, down from 58 in 2023 (≈ –10%).
Source: Training Magazine
Small companies (100–999 employees): 42 hours in 2024, down from 59 in 2023.
Source: Training Magazine
Midsize government/military organizations: The highest: 87 hours on average.
Source: Training Magazine
| Category | 2024 | 2023 (for comparison) |
| Avg. training hours/employee | 47 hours | 57 hours |
| − Small companies | 42 hours | 59 hours |
| − Midsize companies | 43 hours | 48 hours |
| − Manufacturing/distribution | 64 hours (highest) | – |
Training hours by industry
Manufacturers/distributors provide the highest average overall at 64 hours.
Source: Training Magazine
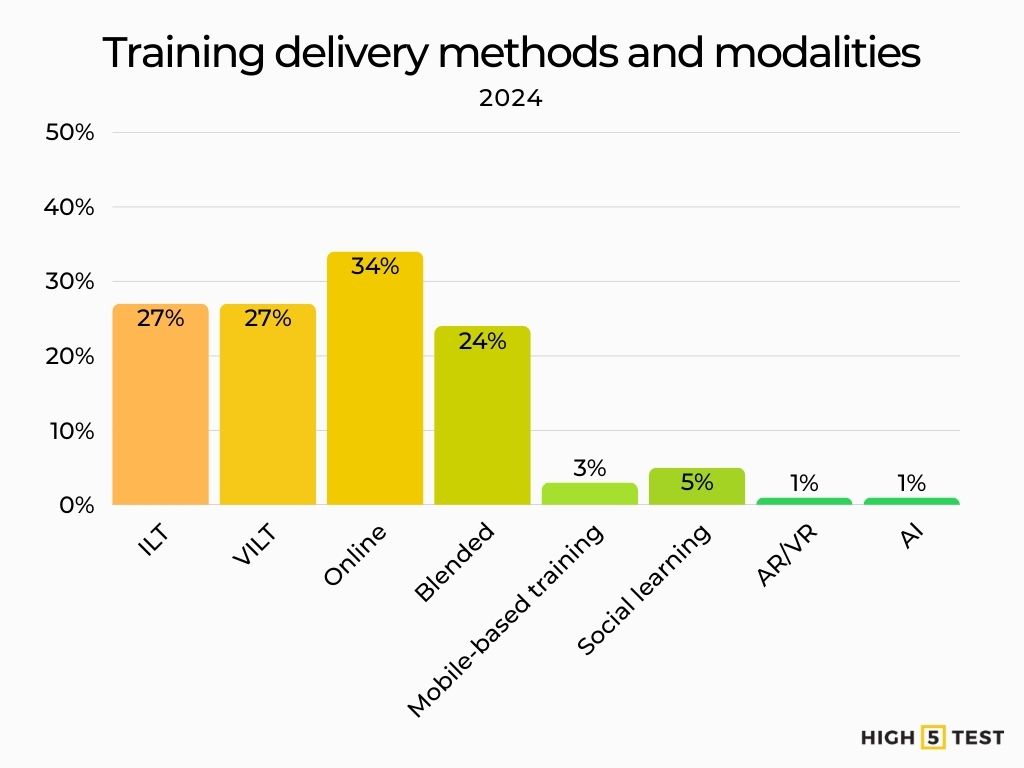
Stats on training delivery methods and modalities
Instructor-Led Training (ILT) vs. Virtual Instructor-Led Training (VILT)
ILT (classroom-based): accounted for 27% of training hours in 2024 (down from 30% in 2023).
Virtual/instructor-led (VILT / webcast): also comprised 27% of hours, a slight drop from 28%.
E-Learning and self-paced online training
Online/computer-based learning: the most used mode at 34% of training hours (up slightly from 33% in 2023).
Blended learning approaches
Blended formats (mix of ILT and digital): 24% in 2024, down significantly from 32% in 2023.
Mobile Learning and microlearning trends
Mobile-based training: only 3% of hours (down from 4% in 2023).
Social learning: accounted for 5% (down from 6% last year).AR/VR and AI: each under 1%, but showing slight growth for AI.
| Delivery Methods (% of training hours) | ||
| − Online / Computer-based | 34% | 33% |
| − Instructor-Led Training (ILT) | 27% | 30% |
| − Virtual Instructor-Led (VILT/Webcast) | 27% | 28% |
| − Blended Learning | 24% | 32% |
| − Mobile Learning | 3% | 4% |
| − Social Learning | 5% | 6% |
| − AR/VR | ~0.3% | ~0.3% |
| − AI | ~0.8% | <0.8% |
Source: Training Magazine
Training delivery today, ROI, and learning tech (2024–2025)
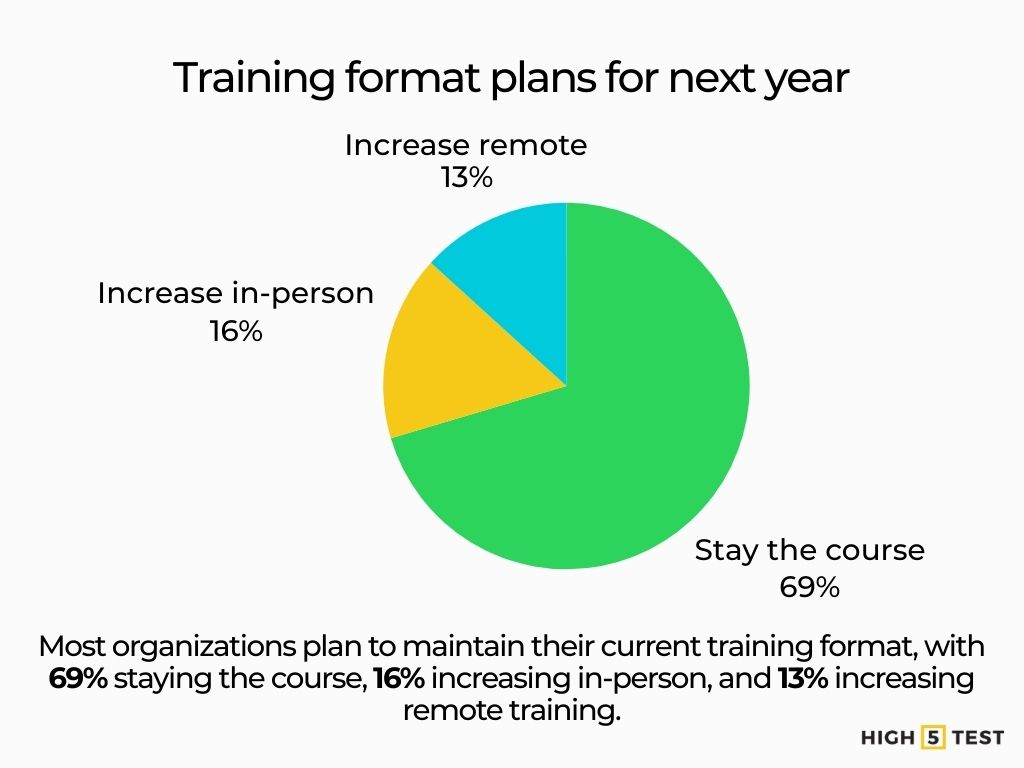
Remote vs. in-person training trends
Most organizations are holding steady on format mix. For the next year, 69% plan to “stay the course” on their split between in-person and remote training; 16% plan to increase in-person, and 13% plan to increase remote.
Source: Training Magazine
Selective return to the classroom. Companies are shifting some topics back to face-to-face—especially management/supervisory (46%), onboarding (41%), and interpersonal skills (35%)—while 28% did not reinstitute any in-person training.
Source: Training Magazine
What’s actually used, by hours: online/computer-based 34%, VILT/webcasting 27%, in-person ILT 27%, blended 24% (with mobile 3%, social 5%). AR/VR each ~0.3%; AI ~0.8% as a primary delivery method.
Source: Training Magazine
Employee preferences: remote vs. classroom training
Flexibility wins, but a sizeable cohort still wants the classroom.54% of U.S. workers preferred flexible methods (e-learning, VILT, hybrid), while about one-third preferred live, instructor-led classroom.
Source: Association for Talent Development
Modality varies by content. Compliance training is mostly online (91% do at least some online; 48% entirely online). Exec development is the least online-heavy (40%).
Source: Training Magazine
Comparing the effectiveness of remote vs. in-person learning
Effectiveness is context-dependent. A 2024–2025 comparative study in medical CPD found similar gains in intention to change behavior after in-person vs. online courses; no significant difference between formats.
Source: PubMed Central
Cost considerations: In certain implementations, virtual training has shown greater cost-effectiveness than in-person training.
Source: TeachFloor
Stats on training effectiveness and ROI metrics
Impact on employee performance and productivity
Career-driven learning correlates with a better business outlook. Organizations classified as “career development champions” are more confident in profitability (75% vs. 64%) and in attracting (71% vs. 58%) and retaining talent (67% vs. 50%) than others.
Source: LinkedIn Business Solutions
Observable outcomes: Companies with stronger career development see higher rates of engaged learners and promotions versus peers.
Source: LinkedIn Business Solutions
Return on Investment (ROI) of training programs
Measurement capability is still a gap. Only 56% of organizations say they can measure the business impact of learning today.
Source: Watershed
Measurement priorities are rising. For 2025, “increasing effectiveness” (30%) and “measuring impact” (16%) rank among the top resource priorities for L&D leaders.
Source: Training Magazine
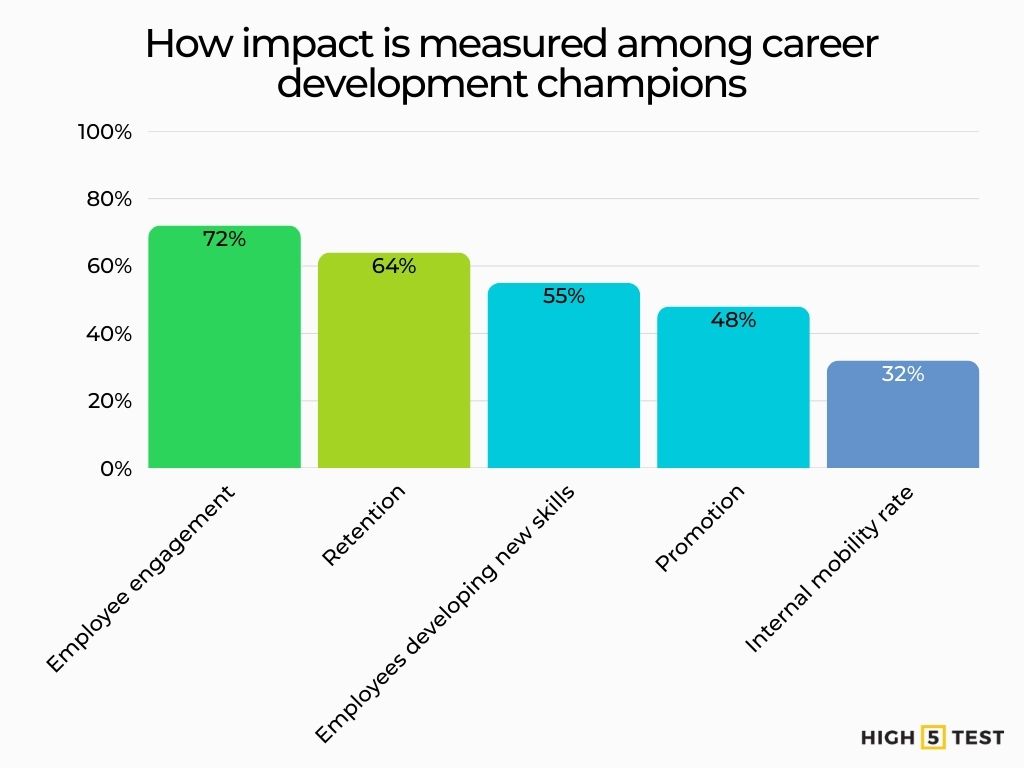
How impact is measured in practice: Among “career development champions,” the most common metrics are employee engagement (72%), retention (64%), employees developing new skills (55%), promotion (48%), and internal mobility rate (32%).
Source: LinkedIn Business Solutions
Training influence on employee retention and turnover
Career development is a core retention lever. In U.S. exit-interview data (2019–2023), Career Development was the #1 controllable reason for leaving (17.5%).
Source: Work Institute
Leadership teams feel it. 88% of organizations are concerned about retention; investing in career development is the top retention strategy cited by L&D leaders.
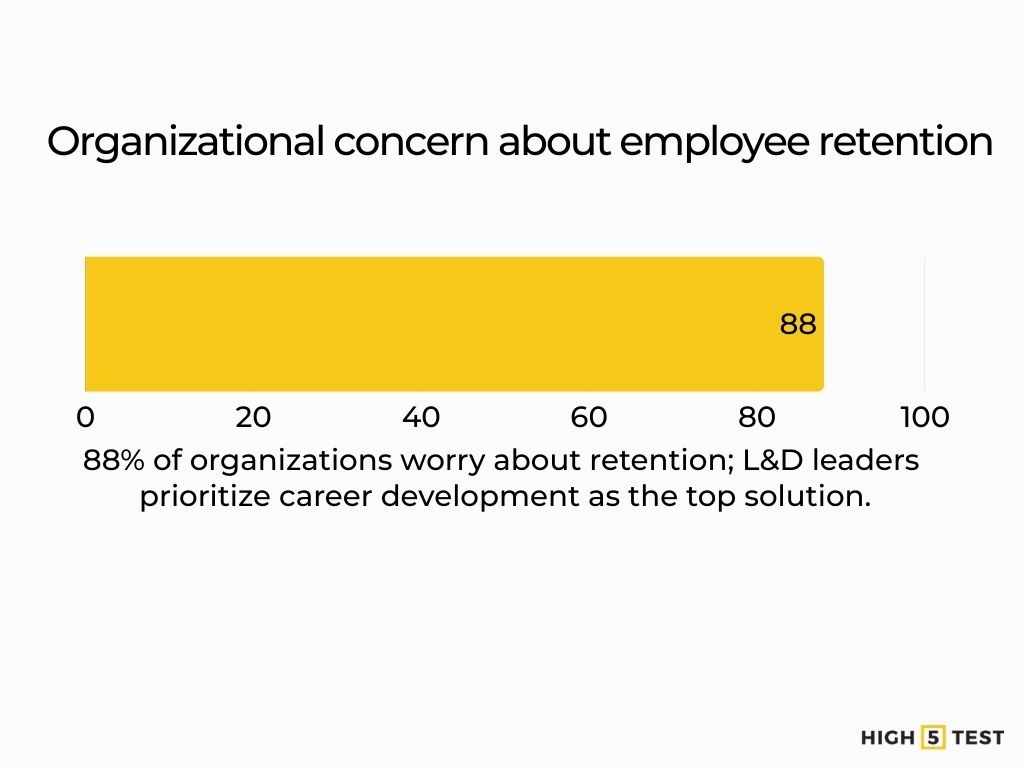
Source: LinkedIn Business Solutions
Stats on learning technologies in employee training
Learning Management Systems (LMS) adoption and usage
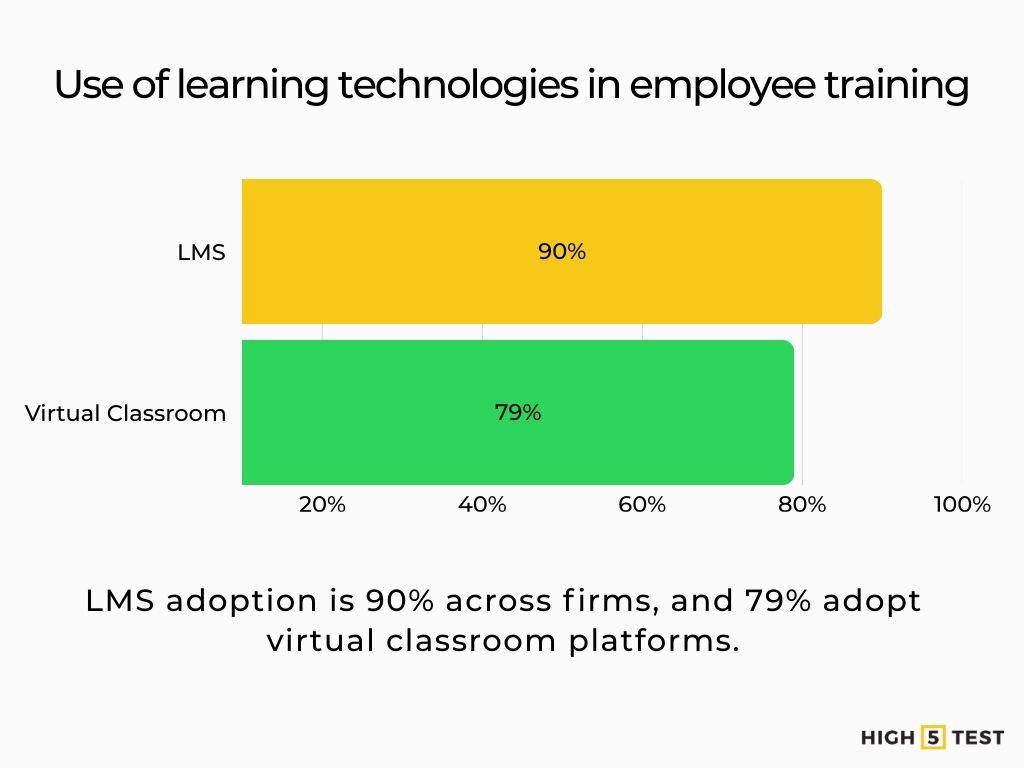
Near-ubiquitous LMS use. 90% of organizations report using an LMS (100% of large, 94% of midsize, 82% of small firms). Virtual classroom tools are used by 79%.
Source: Training Magazine
Operating model: 27% mostly or completely outsource LMS hosting, but LMS administration and learner support are handled in-house by 86%.
Source: Training Magazine
Gamification and game-based learning
Buying plans point to more games/simulations. The #1 anticipated purchase for the year ahead is games and simulations (46%), ahead of online tools/systems (39%).
Source: Training Magazine
Virtual Reality (VR) and Augmented Reality (AR) in training
Usage remains niche. As a technology, VR is used by 7% of organizations and AR by 4%; as a primary delivery method, both account for ~0.3% of hours.
Source: Training Magazine
Artificial intelligence and personalized learning
Rapid uptake in L&D stacks.AI usage in learning technology jumped from 9% in 2023 to 25% in 2024.
Source: Training Magazine
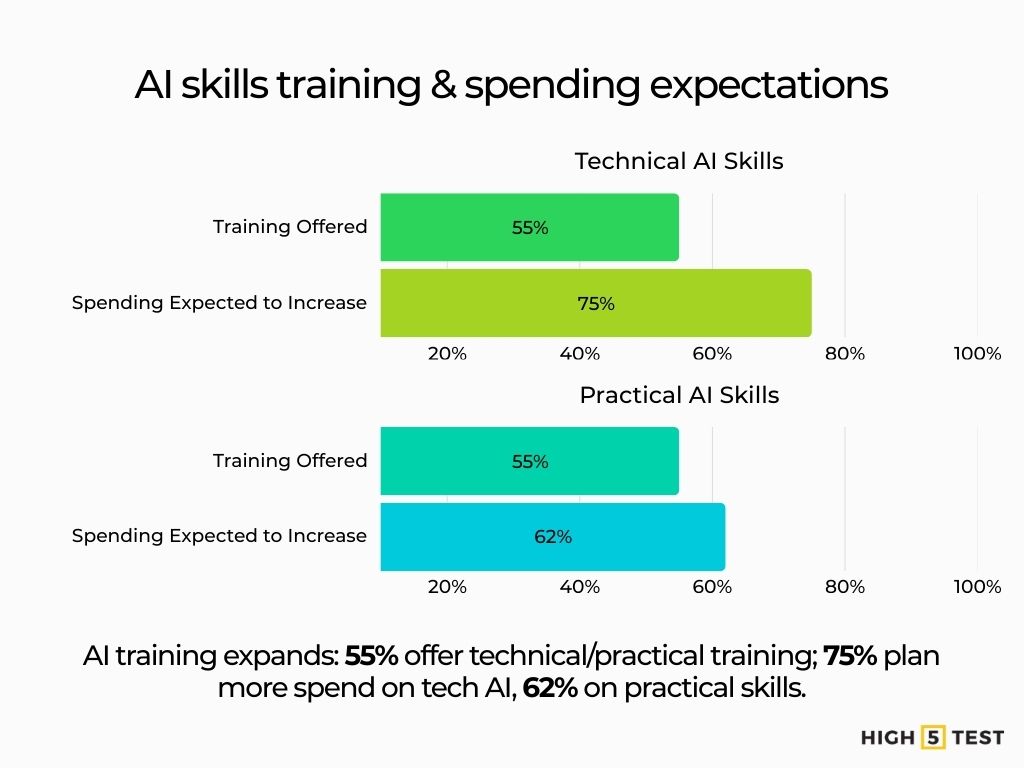
AI skills training is scaling. In 2024, 55% of orgs provided AI technical skills training, and 75% expect to increase AI spending; similar figures for AI practical skills (55% offered; 62% expect increases).
Source: Association for Talent Development
Learning analytics and data-driven training
Capabilities lag ambition. While interest in data & analytics continues to climb in global L&D sentiment surveys (2024–2025), many teams still struggle to evidence value at scale.
Source: Donald H Taylor
Where organizations are focusing: As noted above, measuring program effectiveness and usage are the top 2025 priorities, and engagement/retention are the most commonly used impact KPIs.
Upskilling, leadership, and compliance in employee training statistics
Upskilling and reskilling trends
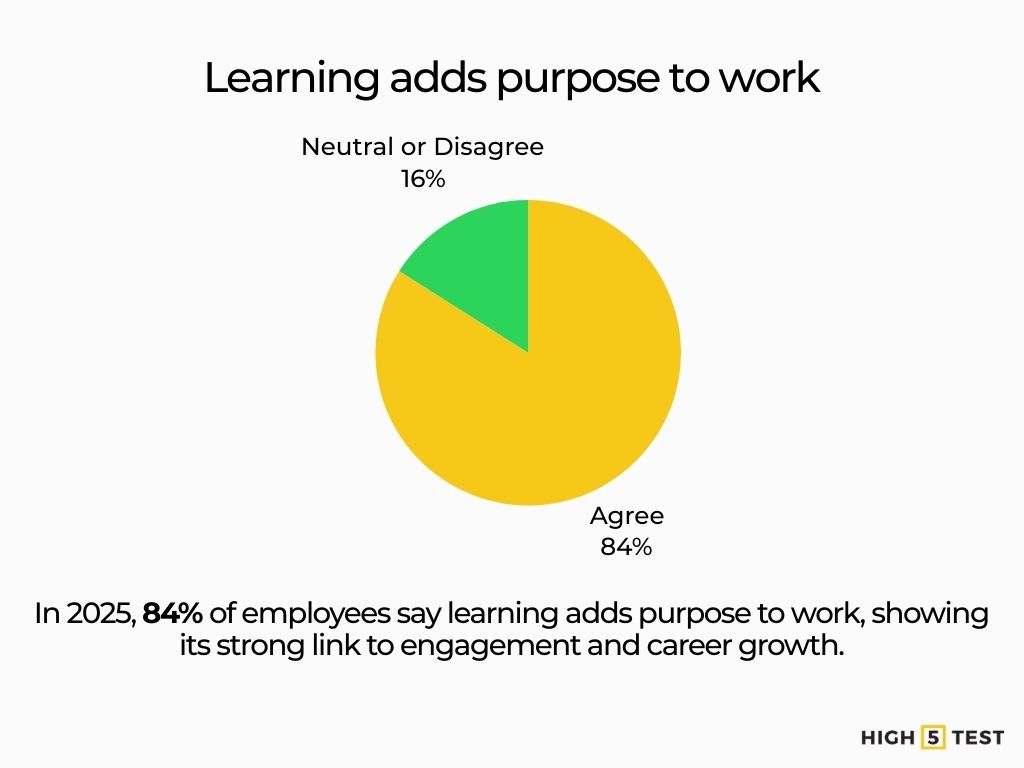
AI + fast-changing skills: It is projected that ~70% of the skills used in most jobs will change by 2030, with generative AI a key catalyst. L&D leaders overwhelmingly rate human skills as increasingly important (91%). 84% of employees say learning adds purpose to their work, and 68% say learning helps them adapt during change.
Source: LinkedIn Business Solutions
Employees want more (formal) training: McKinsey finds nearly half of employees want more formal AI training to adopt the tech effectively.
Source: McKinsey & Company
Corporate upskilling initiatives and investment
AI-skills training is scaling: 55% of organizations offered AI technical skills training in 2024 (e.g., ML, programming) and 55% offered AI practical skills (e.g., prompt writing, AI ethics); ~62–64% expect to increase these offerings going forward.
Source: Association for Talent Development
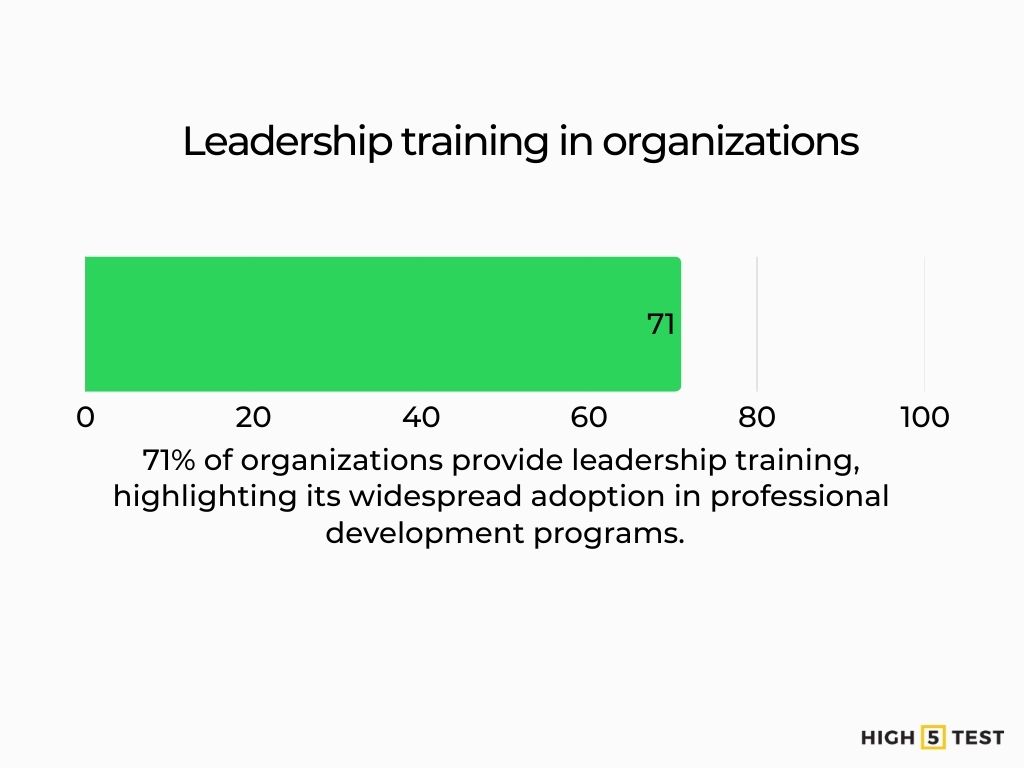
Career-development champions act: Companies strong in career development are 32% more likely to deploy AI training this year and emphasize leadership training, internal mobility, and mentorship. Leadership training is the #1 career practice: 71% of organizations offer it.
Source: LinkedIn Business Solutions
Employee demand for continuous learning opportunities
Upskilling drives retention and mobility: Workers likely to switch employers are nearly 2× as likely to cite upskilling in that decision (67% vs 36%). Only 46% say their employer provides adequate opportunities to learn new skills—highlighting latent demand.
Source: PwC
Learning culture signals matter: Employees see rising value in learning during change (up to 68% in 2025)—a cue for employers to make learning accessible, relevant, and measurable.
Source: LinkedIn Business Solutions
Leadership development and management training
Prevalence of leadership development programs
Leadership development is widespread: 71% of organizations offer leadership training.
Source: LinkedIn Business Solutions
New-manager training statistics and gaps
The “accidental manager” problem persists: Almost 60% of first-time managers never received training when transitioning into leadership; 26% felt unprepared. In 2024, Less than half of managers have received management training.
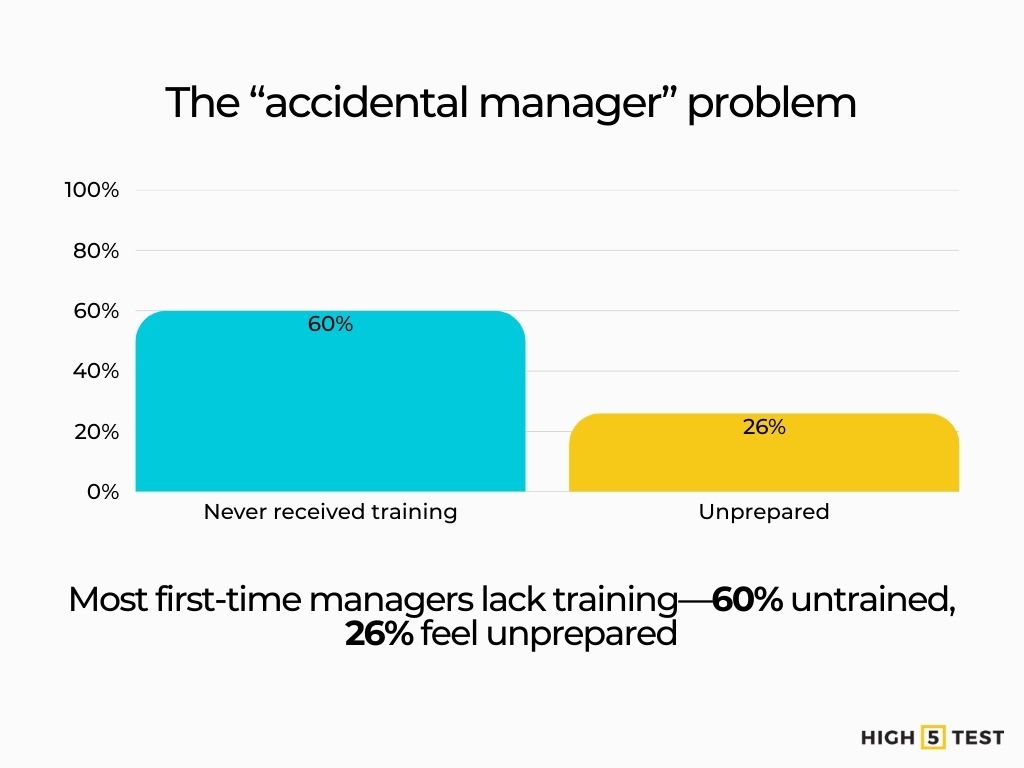
Source: Center for Creative Leadership, Gallup
Outcomes and impact of leadership training
Career development equals better outcomes: Robust career development (leadership training, internal mobility, mentoring) links with stronger promotion outcomes and learner engagement. Meanwhile, manager support for learning dipped 5 percentage points from 2024, signaling the need to prepare managers as coaches.
Source: LinkedIn Business Solutions
Manager capability influences performance: 70% of the variance in team engagement is attributable to the manager, reinforcing ROI for leadership development.
Source: Gallup
Compliance training statistics and trends
Prevalence of mandatory compliance training
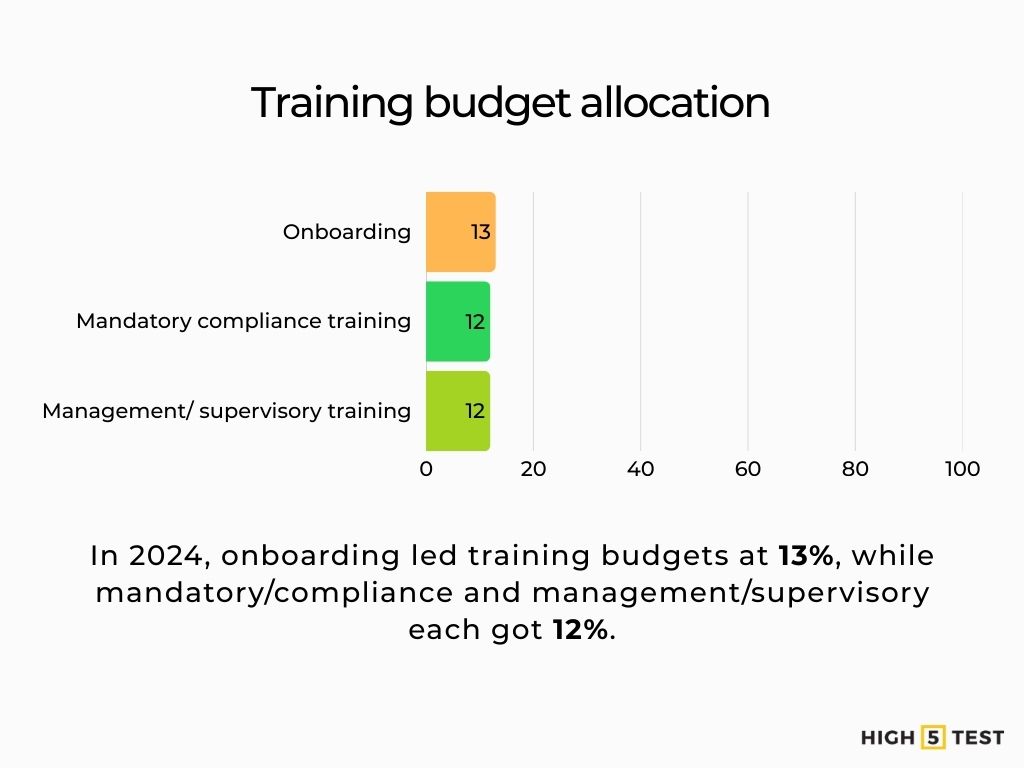
Budget share and focus: In 2024, organizations allocated 12% of training budgets to mandatory/compliance training (on par with management/supervisory at 12%; onboarding led at 13%).
Source: Training Magazine
Modality: 91% of organizations deliver some compliance training online, and 48% deliver it entirely online.
Source: Training Magazine
Time spent on compliance training (annual requirements)
Completion time pressure is real: One-third (33%) of compliance leaders say their programs take employees five or more hours to complete, with 46% under pressure to shorten training time.
Source: Ethena
Effectiveness and challenges of compliance training
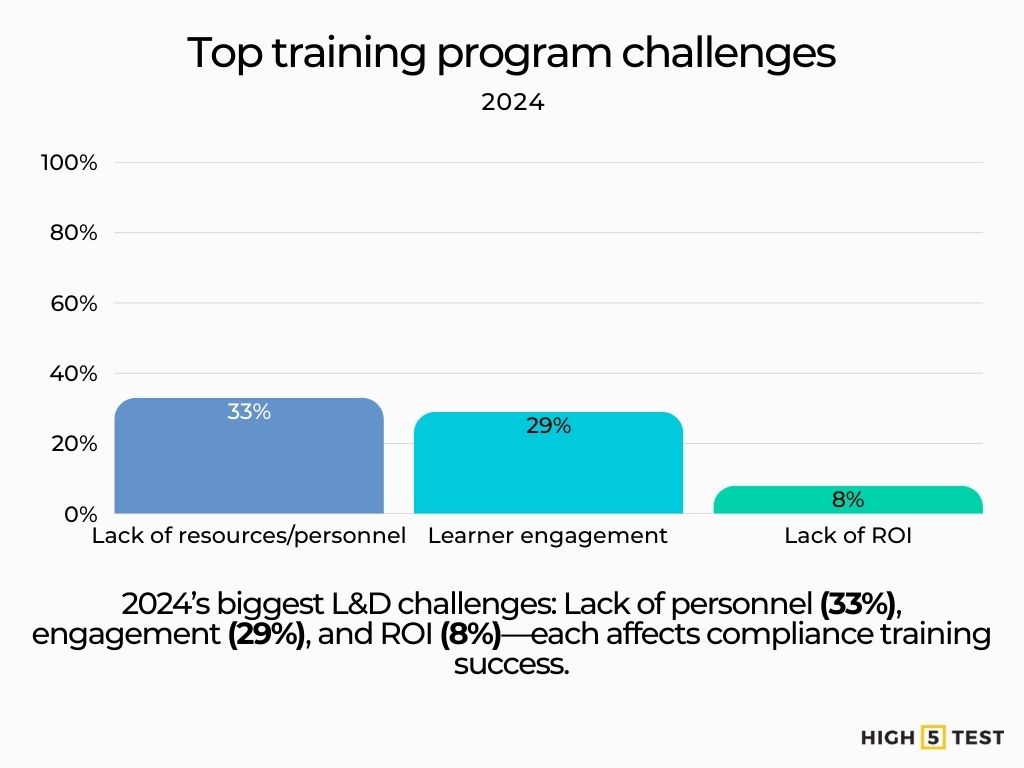
Top program challenges (post-pandemic lens): The biggest training challenges cited in 2024 were lack of resources/personnel (33%), learner engagement (29%), and lack of ROI (8%)—all of which affect compliance curricula too.
Source: Training Magazine
Why employees still slip: 87% of employees recently faced situations where they didn’t know how to comply—uncertainty, not malice, is the leading cause of noncompliance.
Source: Gartner
Stats on onboarding training for new hires
Adoption of structured onboarding programs
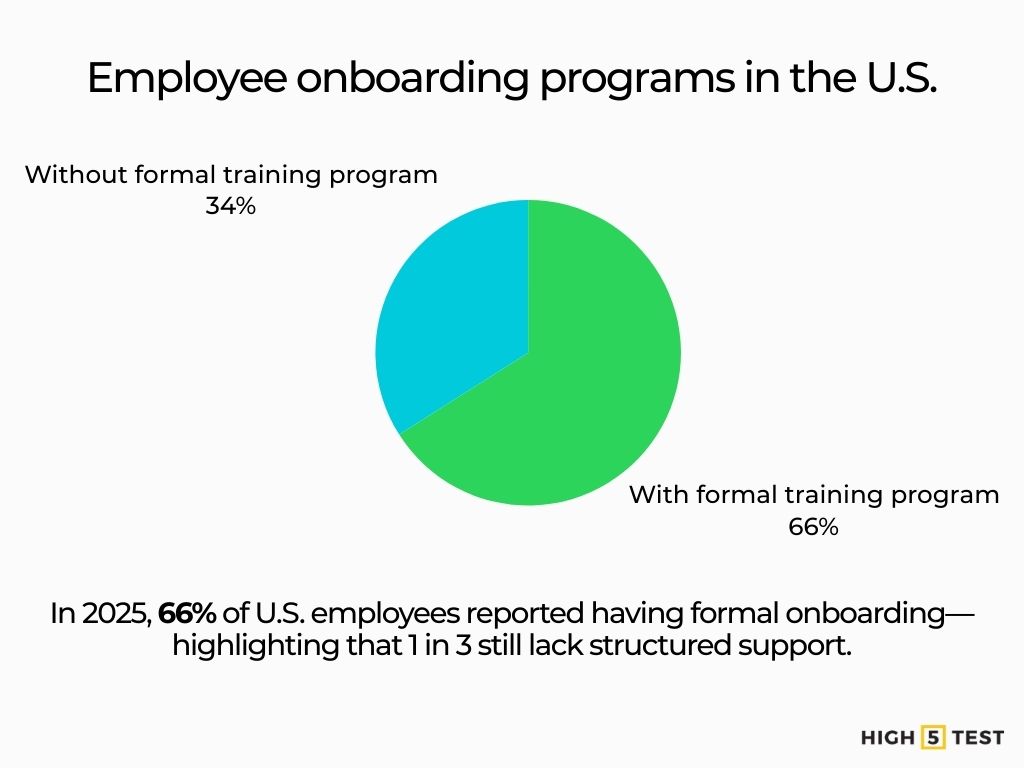
Formal programs are common but not universal. In 2025 round-ups of U.S. onboarding data, roughly two-thirds (66%) of employees say their employer had an official onboarding program—leaving a sizable minority without a structured experience.
Source: Talentech
Preboarding is rising. 65% of employees started onboarding before their official Day 1, signaling earlier, more coordinated hand-offs between TA and HR.
Source: Enboarder
Budget signals priority. U.S. organizations allocated the single largest slice of their 2024 training budgets to onboarding (13%), ahead of compliance and manager training.
Source: Training Magazine
Typical onboarding duration and content
The “first 90 days” focus. HR leader surveys and practitioner guidance in 2025 center on onboarding design around the first 90 days—linking clear milestones, manager hand-offs, and role enablement to early retention and ramp.
Source: Enboarder
What employees say an excellent program includes. There are five recurring components: connection & culture, manager involvement, memorable “wow” moments, and fit-for-purpose tech that streamlines tasks and nudges participation.
Source: Enboarder
Where delivery happens. As firms normalize post-pandemic, 41% brought onboarding back to some in-person delivery in 2024 (often blended with digital).
Source: Training Magazine
Impact of onboarding on retention and time-to-productivity
Poor onboarding triggers early attrition risk. 1 in 3 new hires said they began looking for other jobs soon after starting due to a poor onboarding experience.
Source: Enboarder
Investment in early development reduces quitting intent. Across the broader employee-development lens, workers who feel their employer is investing in their future skills are ~2× as likely to say they do not intend to leave (62% vs. 34%).
Source: ADP Research
Faster ramp and performance ties. Employers report that structured onboarding—especially when manager-led and milestone-based—accelerates new-hire effectiveness and productivity (frequently paired with role-specific training and coaching).
Source: Enboarder
Employee sentiment on training and development
Employee satisfaction with training and development opportunities
Satisfaction is mixed and slipped in 2024. 37% of U.S. workers said they’re extremely/very satisfied with their training and skill-development opportunities in 2024, down from 44% in 2023. 70% say they currently have the training they need to advance; 30% say they need more.
Source: Pew Research Center, Pew Research Center
Training as a factor in engagement and retention
Learning is a top retention lever. In 2024, 90% of organizations were concerned about retention, and “providing learning opportunities” ranked as the No.1 retention strategy.
Source: LinkedIn Business Solutions
Learning fuels purpose. In 2025, 84% of employees agree “learning adds purpose to my work,” underscoring its engagement effect when tied to career growth.
Source: LinkedIn Business Solutions
Upskilling pays off. 2025 workforce analytics show on-the-job upskilling correlates with higher wages and lower intent to leave, reinforcing the business case for continuous development beyond Day 1.
Source: ADP Research
Generational differences in learning expectations
Gen Z is growth-hungry. 53% of Gen Z (vs. 37% of older cohorts) agree that learning helps them explore career paths within their company, so showing clear development pathways early in onboarding matters.
Source: LinkedIn Business Solutions
Career development is a draw. 2025 generational surveys again place learning and development among the top reasons younger workers choose (and stay with) employers. Only 6% say their primary career goal is to reach a leadership position
Source: Deloitte
Conclusion and future outlook
The 2024–2025 picture is clear: onboarding has become a budgeted priority, preboarding is standardizing, and the first-90-days playbook is where HR and managers win or lose new hires. At the same time, employees are discovering their career matches, and their expectations for career-linked learning are rising, especially among Gen Z, making it essential to connect onboarding to an ongoing development journey (skills plans, mentoring, internal mobility). Organizations that blend human connection, manager enablement, and data-informed nudges and visibly invest in people’s future skills are best positioned to cut early turnover and speed time-to-productivity in 2025.